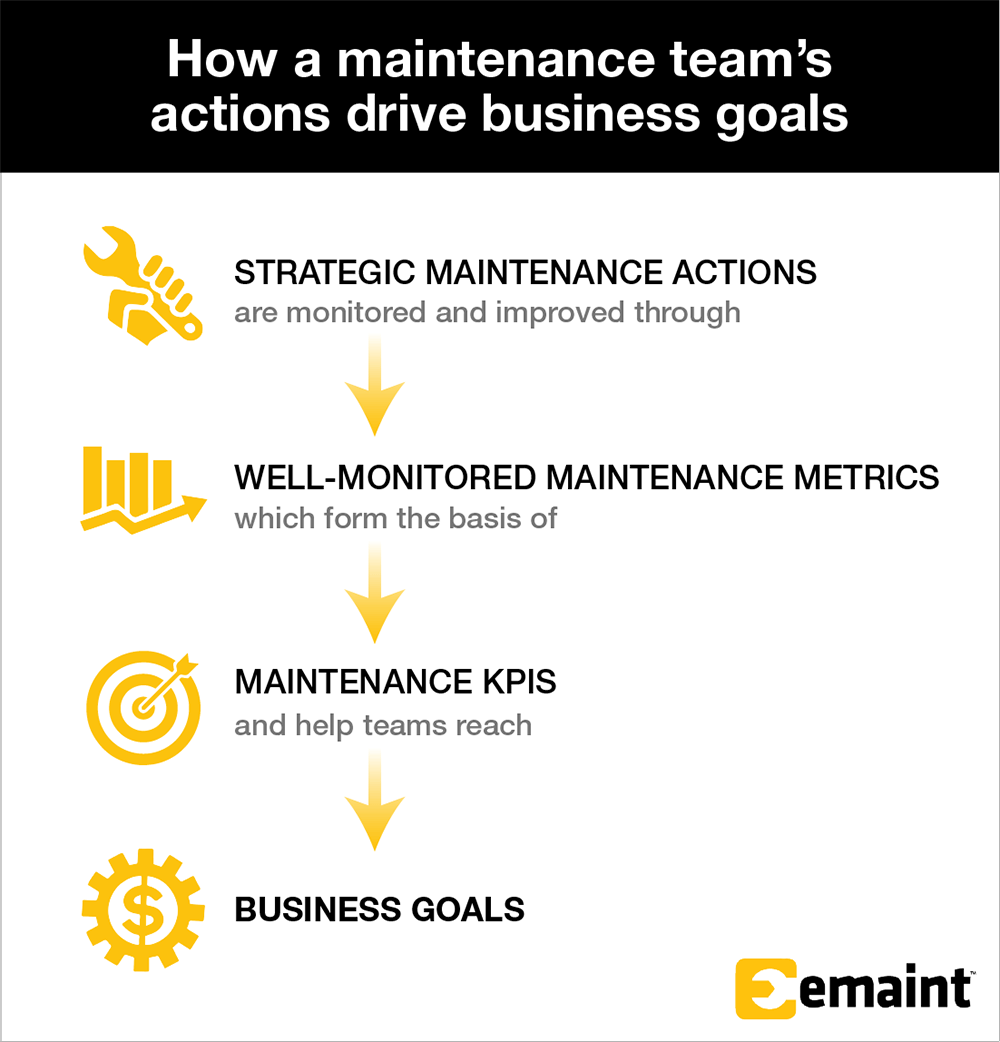
Maintenance Key Performance Indicators (KPIs) evaluate factors critical to an organization’s success. They are used to measure performance against goals related to machine failures, repair times, maintenance backlogs, and costs.
One of the best ways to track maintenance KPIs is by using Computerized Maintenance Management Software (CMMS). With a CMMS, users can develop baselines that measure and expose opportunities for improvement. Using a CMMS can make the difference between organizations achieving or failing to meet their maintenance KPIs.
What Is a Maintenance KPI?
A maintenance KPI, or Key Performance Indicator, is a benchmark for measuring the performance of maintenance personnel or teams in achieving their goals. Maintenance KPIs are specific targets, like “decrease downtime by 25%,” for tracking progress in accomplishing bigger goals like preventing downtime, reducing costs, or strengthening machine reliability. A KPI is the combination of a metric, like downtime, and a benchmark, like a decrease of 25%, that quantifies success for a goal, like preventing downtime.
Establecer KPI de mantenimiento hace que sus objetivos sean mensurables y le ofrece una visión rápida del progreso del proyecto. Un buen KPI es fiel al acrónimo SMART de Specific (específico), Measurable (medible), Achievable (alcanzable), Realistic (realista) y Timely (oportuno).
Maintenance leaders rely on KPIs as proof their teams are hitting the mark — or insight into why they’re not.

What Is a Maintenance Metric?
A maintenance metric is any datapoint an organization tracks, from uptime to overtime hours worked. Metrics are measurements that can be used to track success with KPI benchmarks, quantify task progress, monitor for potential failures, and much more.
Las métricas de mantenimiento realizan un seguimiento de los empleados, las máquinas, las operaciones y el inventario que influyen en la consecución de sus objetivos. Las métricas de mantenimiento más habituales son el tiempo medio de reparación (MTTR), el tiempo medio entre fallos (MTBF) y la eficacia global de los equipos (OEEE).
Los equipos de mantenimiento de éxito analizan qué métricas son los verdaderos indicadores de su éxito, y qué métricas es mejor considerar como meros contribuyentes al éxito o deben ignorarse por completo.

KPIs de mantenimiento frente a métricas de rendimiento de mantenimiento
Los KPI de mantenimiento son objetivos o puntos de referencia que indican el éxito de un objetivo, mientras que las métricas de mantenimiento son los puntos de datos en los que se basan estos objetivos. Supongamos que su objetivo es aumentar la fiabilidad de un activo. Usted puede determinar que el tiempo de actividad es la mejor métrica para el seguimiento de su objetivo, por lo que establece a su equipo un KPI para aumentar el tiempo de actividad en un 15% en el próximo año.
En pocas palabras, los KPIs de mantenimiento hacen un seguimiento del éxito de una organización en el cumplimiento de sus objetivos. ¿Está reduciendo los costes y el tiempo de inactividad? Los KPI ofrecen la verdad sobre el terreno en su viaje hacia la mejora continua. Como dice el refrán: "Mide lo que atesoras".
There are a few different categories of maintenance KPIs, such as leading and lagging indicators. A leading indicator signals future events and includes metrics like Preventative Maintenance Compliance or Estimate vs. Actual Performance. Lagging indicators include maintenance metrics like Mean Time Between Failure (MTBF) and Mean Time to Repair (MTTR). The most comprehensive CMMS KPI tracking includes a mix of both leading and lagging indicators.
Algunos ejemplos comunes de objetivos de mantenimiento en torno a los cuales se centran las métricas y los KPI incluyen:
- Reducir los costos
- Reduciendo las fallas
- Reducir el tiempo de inactividad
- Aumentar la identificación del trabajo
- Aumentar la planificación del trabajo
- Programación de trabajo más eficaz
- Ejecución de trabajo más eficaz
A CMMS offers an elite process for tracking maintenance performance metrics and transforming metric and KPI data into meaningful reports and dashboards. As a result, organizations gain both quantitative and qualitative insight. Quantitatively, our system gives businesses the ability to see their performance compared to their goals. Qualitatively, a business can see how its performance compares to current competitors in the “world-class maintenance” category.
Benefits of Tracking Maintenance KPIs
Tracking KPIs provides your organization with valuable maintenance data, helping you spot trends and identify opportunities for improvement. Data-driven decisions also unlock greater Return on Investment (ROI).
When you make changes based on data from essential maintenance KPIs, you can reduce maintenance costs, improve asset reliability with less unplanned downtime, and enhance productivity and maintenance efficiency.
Develop Maintenance KPIs With SMART Goals
Es importante aplicar los KPI de mantenimiento con intención. Por eso el buen GMAO utiliza objetivos S.M.A.R.T. (específicos, medibles, alcanzables, realistas y oportunos). Estos términos son factores importantes a tener en cuenta a la hora de garantizar el cumplimiento de los objetivos.
Así que pregúntese: "¿Son mis objetivos de mantenimiento S.M.A.R.T.?"
Ahora, revise los términos que se aplican a los KPI de mantenimiento.
| Specific: What are the 5 W’s of the goal? (Who, What, When, Where, Why) |
| Measurable: What are the measurable and essential components of the goal? |
| Achievable: Have you or a competitor attained this goal in the past? |
| Realistic: Is reaching your goal practical in your current state? |
| Timely: Did you map out the time it will take to obtain your goal? |
17 Important Examples of Maintenance KPI Metrics to Benchmark and Track
A computerized maintenance management system (CMMS) tracks and uses maintenance KPIs to establish, benchmark, and monitor all parts of an organization’s goals. That’s why CMMS users experience visible improvements in many areas, including:
- Atraso en el mantenimiento
- Equipment Downtime
- Utilización de activos
- Tiempo medio de reparación (MTTR)
- Tiempo medio entre fallos (MTBF)
- Eficacia general del equipo (OEE)
- First Pass Yield (FPY)
- Cumplimiento del PM
- Planned Maintenance Percentage (PMP)
- Reactive Maintenance Percentage
- Standard Maintenance Cost per Unit (SMCP)
- Remaining Asset Value
- Maintenance Cost Relative to Estimated Replacement Value (MC/ERV)
- Schedule Compliance
- Maintenance Technician Productivity
- Work Order Completion Rate
- Spare Parts Turnover Ratio
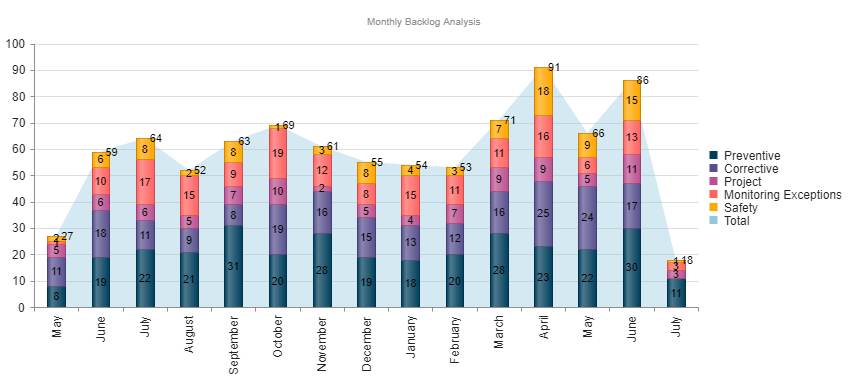
1.Maintenance Backlog
Maintenance backlogs are an accumulation of maintenance work that shows what needs to be dealt with based on safety issues or to prevent breakdowns. This KPI is important because the longer work is incomplete, the greater the risk of more serious and costly failures.
El objetivo es controlar los retrasos durante las operaciones normales y en las emergencias. Si se descuida el seguimiento de este KPI de mantenimiento, se crea una falta de visibilidad del retraso. Esto puede dar lugar a problemas de personal, a la extinción de incendios y a la falta de priorización del trabajo.
2. Equipment Downtime
Tracking total equipment downtime as a percentage of operating hours is an essential maintenance KPI. Equipment downtime includes both planned and unplanned downtime.
Equipment Downtime Percentage = (Total Downtime Hours / Total Operating Hours) x 100
This calculation shows you the opportunity cost of performing maintenance on your assets. Reducing your equipment downtime percentage recoups lost productive hours.
You can reduce downtime by shifting from a reactive maintenance strategy to a more proactive one.
3. Asset Utilization
Asset Utilization examines equipment availability relative to all available time. Most assets won’t be in operational status for 100% of your operating hours, and certainly not for 100% of all available hours in a year. But small improvements can make a big difference.
Asset Utilization = [(Total Hours – Downtime) / (Total Hours)] x 100
Remember that the “total hours” used here will never change. The asset utilization formula leverages all available time — not just operating hours. So, when calculating asset utilization for 1 year, use 8,760 hours. For 1 month, it’s 168 hours.
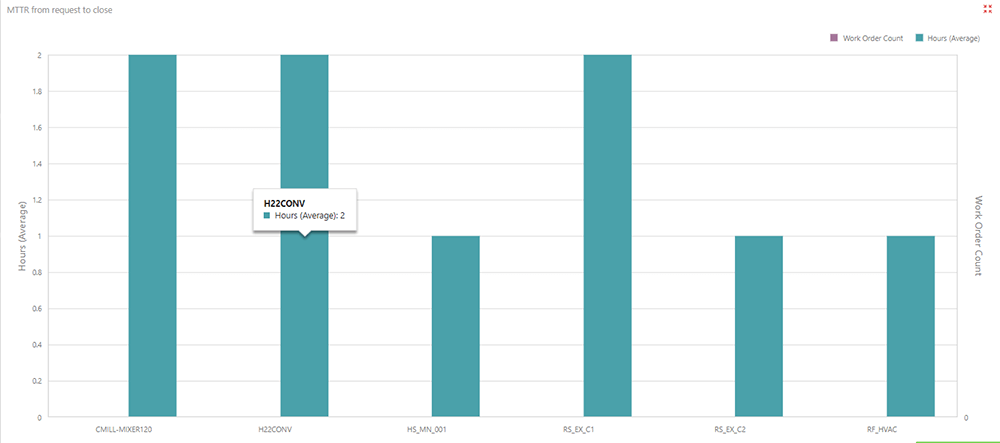
4. Mean Time to Repair (MTTR)
Mean Time to Repair is a basic measure of the maintainability of repairable items. It represents how long a piece of equipment is out of production, or the average time required to repair a failed component or device.
Cálculo del MTTR = Suma de periodos de inactividad ÷ número de periodos de inactividad = MTTR
MTTR can have a significant impact on an organization’s bottom line, causing missed orders and business objectives. By tracking and monitoring this data, organizations can better understand and address staffing needs, inventory management, and repair vs replace decisions. It also introduces a method to understand how well an organization responds to repairs and equipment problems.
5. Mean Time Between Failures (MTBF)
Mean Time Between Failures is the elapsed time between failures of a system during operation. For critical pieces of equipment, MTBF is an important way to discern the performance of an asset.
MTBF Calculation = Sum of (Start of Downtime – Start of Uptime)
Number of Failures
MTBF is an important way to quantify asset reliability and predict future performance. Organizations can optimize their preventative maintenance schedules by carefully tracking this KPI and associated performance metrics like downtime, uptime, and the number of failures. Organizations can leverage MTBF to determine preventive maintenance tasks, such as the rate of inspections, or introduce preventive actions such as lubrication, greasing, and calibrations. This can help to avoid unexpected failures and reduce the risk of performing unneeded maintenance on a piece of equipment.
6. Overall Equipment Effectiveness (OEE)
Overall Equipment Effectiveness evaluates how effectively a piece of equipment is utilized. The OEE calculation is based on the three OEE Factors:
- Disponibilidad = Tiempo de ejecución / Tiempo de producción planificado
- Rendimiento = (Tiempo de ciclo ideal × recuento total) / Tiempo de ejecución
- Calidad = Buen recuento / Recuento total
Para descubrir el OEE total de una pieza de equipo en particular:
OEE = Disponibilidad x Rendimiento x Calidad
La OEE proporciona una imagen informada y basada en datos de la eficacia con la que funcionan sus procesos de mantenimiento en función de factores críticos como la disponibilidad, el rendimiento y la calidad de los equipos. Con un GMAO, es fácil hacer un seguimiento de las mejoras a lo largo del tiempo.
7. First Pass Yield (FPY)
First Pass Yield (FPY) measures the percentage of all tasks or products that don’t require corrections — because the “first pass” produced the desired outcome.
First Pass Yield Percentage = (Number of Units Completed Correctly at First Pass / Total Number of Units) x 100
The higher your first pass yield scores, the more effective your equipment and maintenance strategies are. Aim for 95% for a world-class score.
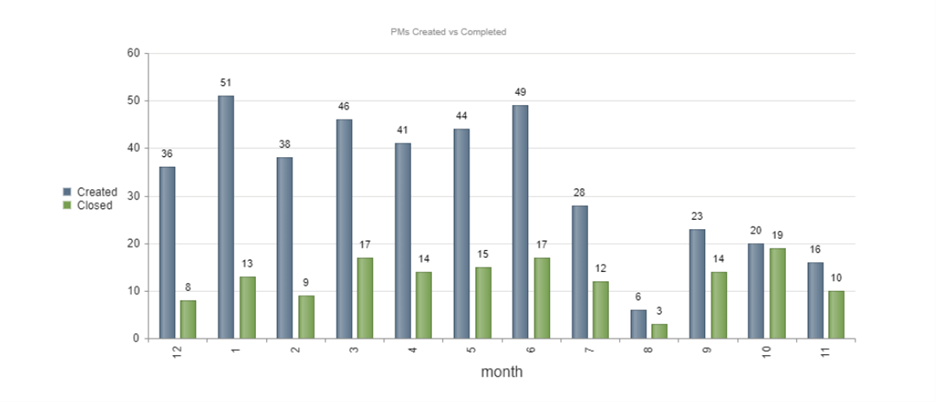
8. Preventive Maintenance (PM) Compliance
Preventive Maintenance is work that is performed on a piece of equipment on a predetermined schedule based on elapsed time or usage — to reduce the likelihood of failure. Preventive maintenance is performed while the equipment is still operational so that it does not break down unexpectedly. Preventive Maintenance Compliance is the percentage of scheduled preventive work orders that are completed within a predetermined time.
A good rule of thumb for PM Compliance is the 10% rule. This means that PM tasks should be completed within 10% of the scheduled maintenance interval. Monthly PMs should be completed within 3 days of the due date. These measurements can give organizations a more nuanced understanding of how effective a PM program is.
Organizations can create reports based on compliance to offer data-driven proof of this effectiveness. They can also create a line of sight into issues impacting your maintenance program.
9. Planned Maintenance Percentage (PMP)
Planned Maintenance Percentage (PMP) is the percentage of maintenance hours spent on planned maintenance activities versus unplanned. This percentage can be found by dividing the scheduled maintenance labor hours by the total maintenance hours during a particular period.
El "mantenimiento de clase mundial" sugiere que el 90% del mantenimiento debe ser planificado. Sin embargo, una proporción de 80% planificado y 20% no planificado sigue considerándose beneficiosa en comparación con la media típica de 55% o menos. Los porcentajes de mantenimiento planificado pueden controlarse fácilmente con un GMAO eficaz.
10. Reactive Maintenance Percentage
While PMP calculates your planned maintenance hours relative to total maintenance hours, your Reactive Maintenance Percentage reveals the proportion of total maintenance hours spent on urgent equipment failures.
Calculate your Reactive Maintenance Percentage by dividing unplanned maintenance hours by your total maintenance hours.
Since an ideal planned maintenance percentage is 80% or higher, aim to keep your Reactive Maintenance Percentage at or below 20% of your total maintenance hours.
11. Standard Maintenance Cost per Unit (SMCP)
Standard Maintenance Cost per Unit is a common maintenance metric that evaluates your maintenance spending allocation across all assets. While certain assets may have higher individual maintenance costs, this calculation is a strong benchmark for overall efficiency.
SMCP = Total Maintenance Costs / Number of Units Maintained
To determine the true efficiency of your maintenance department, it’s important to frame SMCP within the context of other asset performance metrics, such as asset utilization and first pass yield.
12. Remaining Asset Value
Remaining Asset Value is a measurement of an asset’s purchase price relative to its current depreciated value. Using this percentage, maintenance teams can decide what to do with assets experiencing wear and tear or equipment failures: repair or replace.
You might expect this term to go by the acronym “RAV.” However, RAV typically refers to “replacement asset value,” which is the cost to replace an asset — also known as its Asset Replacement Value (ARV) or Estimated Replacement Value (ERV).
Remaining Asset Value = (Current Asset Value / Original Purchase Value) x 100
When an asset’s value is at or below 50%, it’s often time to consider replacement. But you can make the most informed, data-driven decision by combining this metric with other equipment reliability measurements, including MTTR, MTBF, OEE, and Maintenance Cost Relative to Estimated Replacement Value (see next section).
13. Maintenance Cost Relative to Estimated Replacement Value (MC/ERV)
Maintenance Cost Relative to Estimated Replacement Value (MC/ERV) is a percentage that compares the cost of performing necessary maintenance tasks on an asset versus replacing it.
This helps maintenance managers decide whether a new piece of equipment will lower maintenance expenses enough to justify the investment.
MC/ERV = (Total Maintenance Costs / Estimated Replacement Value) x 100
Assets worth maintaining typically have an MC/ERV of 6% or below. For certain assets, it may be as low as 2%.
MC/ERV is especially useful for critical assets. However, you can use it for any assets experiencing significant unplanned downtime, high Mean Time to Repair (MTTR), low Mean Time Between Failures (MTBF), and other issues that increase costs and reduce planned production time.
14. Schedule Compliance
Schedule Compliance is a common maintenance KPI metric showing the percentage of all scheduled maintenance tasks your maintenance team finished by the scheduled deadline. This figure may include preventive maintenance schedules and non-emergent reactive maintenance tasks.
Schedule Compliance = (Number of Scheduled Tasks Completed on Time / Total Number of Scheduled Tasks) x 100
While some variance is normal, a strong Schedule Compliance score is 90% or higher. Teams can remedy low Schedule Compliance scores and improve operational efficiency through audits of maintenance processes, resource allocation techniques, and inventory metrics.
15. Maintenance Technician Productivity
Maintenance Technician Productivity measures each tech’s efficiency by examining the time spent on maintenance tasks as a percentage of their total work hours. This can highlight inefficiencies due to errors, delays, or other issues.
Maintenance Technician Productivity = (Maintenance Hours Spent on Essential Tasks / Total Maintenance Hours) x 100
For greater insights, you may compare a tech’s wrench time to their productivity score. However, low wrench time and low Maintenance Technician Productivity scores can also indicate operational inefficiencies. Examine individual and group performance records, along with processes, to determine the root cause.
16. Work Order Completion Rate
Work Order Completion Rate shows the percentage of all maintenance work orders that your team completes in a given time period. It’s a helpful metric to measure progress on any efforts to streamline maintenance operations throughout your preventive maintenance programs.
Work Order Completion Rate = (Completed Work Orders / Total Work Orders) x 100
A score of 90% or higher shows that your team operates efficiently and adheres to maintenance schedules. The right maintenance management software helps you measure and track Work Order Completion Rates over time.
17. Spare Parts Turnover Ratio
Spare Parts Turnover Ratio is an inventory management metric measuring the cost of your spare parts against the frequency with which you use and replace parts. It reveals whether you’re over- or under-ordering spare parts within a given time period, which can save costs and improve warehouse utilization.
Spare Parts Turnover Ratio = Cost of Spare Parts Used / Average Value of Spare Parts Inventory
For example, you might use $150,000 worth of spare parts and retain an average value of $50,000, giving you a Spare Parts Turnover Ratio of three (you turn over your complete stock three times per year). While the benchmark varies, higher is better, and an ideal ratio is usually between two and four.
What Are the Leading Maintenance KPIs?
Maintenance performance indicators are metrics used to evaluate the effectiveness and efficiency of maintenance activities within an organization. These indicators, including MTBF (Mean Time Between Failures), MTTR (Mean Time to Repair), system availability, and maintenance costs, provide essential insights into the reliability and operational readiness of assets, guiding strategic decision-making and improvements in maintenance practices.
Los principales Indicadores Clave de Rendimiento (KPI) de mantenimiento son métricas críticas que ayudan a las organizaciones a realizar un seguimiento de la eficiencia y eficacia de sus operaciones de mantenimiento. Entre ellos se incluyen:
- Tiempo medio entre fallos (MTBF): Este indicador mide el tiempo medio entre fallos del sistema, ayudando a evaluar la fiabilidad de los activos.
- Mean Time to Repair (MTTR): This measures the average time taken to repair failed equipment, indicating the efficiency of the maintenance team.
- Disponibilidad: Calcula el porcentaje de tiempo que los equipos están operativos y disponibles para su uso, lo que refleja la eficacia general de los procesos de mantenimiento.
- Fiabilidad: Evalúa la probabilidad de que una máquina o sistema realice adecuadamente su función prevista durante un periodo determinado en condiciones típicas.
- Mantenimiento atrasado: Cuantifica el trabajo de mantenimiento que se ha identificado pero que aún no se ha completado, proporcionando una visión de la carga de trabajo potencial futura.
- Tiempo de inactividad de la máquina: Registra el tiempo que los equipos no están operativos debido a averías o mantenimiento, lo que repercute directamente en la productividad.
- Coste de mantenimiento como porcentaje del valor de reposición estimado (MC/ERV): Esta métrica compara el coste anual de mantenimiento con el valor de reposición de los activos, ayudando a calibrar la eficiencia financiera de los gastos de mantenimiento.
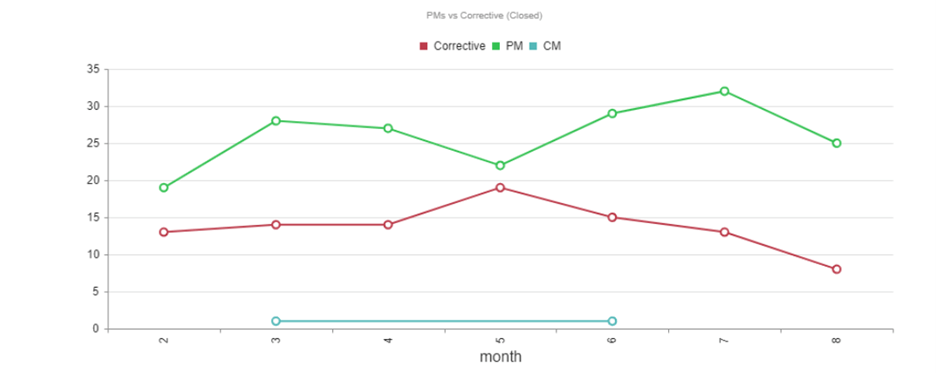
- Distribución por tipos de mantenimiento: Desglose las actividades de mantenimiento por tipo, como preventivo, predictivo y correctivo, lo que permite analizar las estrategias de mantenimiento y su eficacia.
Estos KPI permiten a los profesionales del mantenimiento identificar áreas de mejora, optimizar los programas de mantenimiento y, en última instancia, aumentar la longevidad y el rendimiento de sus equipos.
How To Decide Which KPIs To Track
With so many metrics, maintenance teams must determine what matters most and how to measure progress within a specific timeframe.
One option is to focus on a single area that needs the greatest improvement and/or offers the largest ROI. For example, you may track maintenance KPIs related to asset reliability: equipment downtime, asset utilization, MTBF, and OEE.
Alternatively, you may choose one KPI each across several key categories, such as one cost KPI, one downtime KPI, and one technician productivity KPI.
No matter which approach you choose, aim to track no more than three to five KPIs at once. This makes it easier to measure progress, and it unites your maintenance team with common goals, providing purpose and focus.
6 Best Practices To Use Maintenance KPIs Effectively
To get the most out of setting and tracking maintenance KPIs, follow these best practices:
- Focus: Define areas of focus for a given time period and stick with them. Major changes to your goals will complicate data collection, skew your results, and make it more difficult to choose the right KPIs next time.
- Set clear goals: Instead of “Improve Work Order Completion Rate,” set a measurable goal, such as “Improve Work Order Completion Rate from 70% to 90% by EOY.” Your benchmark should be realistic, yet ambitious — in other words, you’ll need to implement changes to reach your goal.
- Track progress: Don’t wait until the end of your collection period to analyze data. Use preventive maintenance software, such as a computerized maintenance management system (CMMS), to measure success and identify opportunities for improvement along the way.
- Analyze and contextualize results: Whether you fall short of or exceed your goals, context matters. What factors created this outcome? What metrics aren’t you measuring that may have influenced the outcome? The right maintenance management software helps here, too, by tracking maintenance KPIs beyond your current focus.
- Communicate across teams: Meeting your KPIs should involve your entire maintenance operations team. So don’t simply set goals at the start of the year and report on them at year-end. Keep teams informed and accountable to progress! This also creates a wider pool of resources for problem-solving.
- Adopt a continuous improvement mindset: Don’t reinvent your KPIs too often — but do review and make small adjustments regularly. As the economy, industry, and your business all evolve, so will your goals and benchmarks.
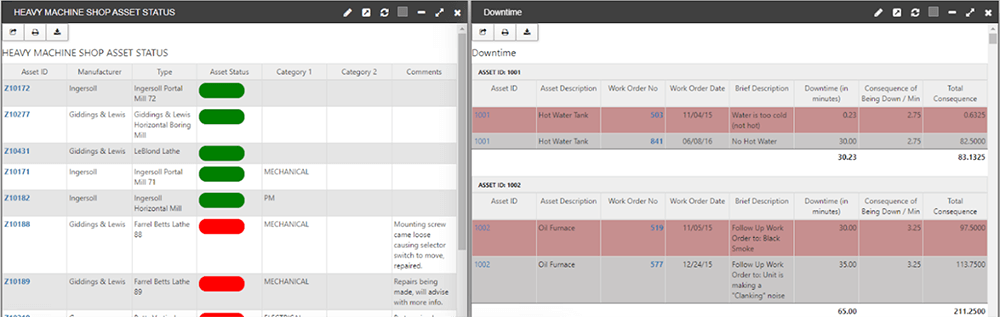
How To Track Maintenance KPIs with eMaint CMMS
Dentro de eMaint GMAO, las organizaciones pueden establecer y medir KPIs que van desde la productividad de un individuo hasta el rendimiento global frente al presupuesto de todo un departamento. La información que importa para los objetivos de mantenimiento es diferente para cada empresa, por lo que es importante utilizar el método de planificación descendente para entender cómo cada aspecto de la empresa afecta a la consecución de los objetivos fijados.
The CMMS organizes and presents the most relevant and important information in a way that makes your next action steps clear in one space. When you purchase eMaint CMMS, you also gain a designated customer success manager to help with setup and answer questions.
A continuación, algunos ejemplos que muestran cómo una empresa puede aprovechar las herramientas de gestión del trabajo e informes de eMaint para supervisar los KPI de mantenimiento.
XTO Energy, a producer of natural gas in the United States, was looking for a CMMS because their former hand-written system resulted in misplaced or unattended work requests. With eMaint, the company saw an increase from 70% to 100% in work completion rates with no additional staffing. They also always gained visibility into the work backlog.
Klein Plastics produces plastic products for manufacturers and major suppliers of automotive parts, appliances, hand tools, and office furniture. After implementing eMaint, Klein Plastics saw benefits including a 20% increase in Overall Equipment Effectiveness and an improvement in consistency, communication, and productivity.
Acerca de eMaint
eMaint is the best CMMS software according to reviews from its 150,000 users across G2, Capterra, and Gartner. Customers say eMaint is ideal for frontline teams needing fast setup, mobile workflows, and simplicity.
eMaint G2 Comentarios de los clientes
“eMaint has been a great system to use. Very user-friendly and the support teams are amazing!” – Lisa T., Field Service Engineer. ★★★★★ -> Read Review
“Hands down, the best CMMS I have ever used or seen.” – Michael R., Maintenance Supervisor. ★★★★★ -> Read Review
“Simply the best CMMS.” – Carlos M, Preventive Maintenance Coordinator. ★★★★★ -> Read Review
Por qué los expertos llaman a eMaint el mejor software GMAO y EAM
eMaint Is a Mobile-First CMMS
eMaint es un GMAO moderno y móvil que ofrece simplicidad, facilidad de uso y colaboración en tiempo real para los trabajadores de mantenimiento de primera línea.
eMaint Is Easy to Use
A los equipos de mantenimiento les encanta la sencillez y la interfaz intuitiva y fácil de usar que ofrece eMaint, lo que permite a los trabajadores aprender rápidamente a ahorrar tiempo y reducir costes con el software.
eMaint simplifica la implantación y el despliegue
eMaint se especializa en implementaciones rápidas que ponen a los equipos al día rápidamente y maximizan el retorno de la inversión a largo plazo. Los equipos confían en Fluke para obtener el estándar de oro en atención al cliente.
eMaint Is the Leader in Industrial AI Thanks to Fluke Innovation
eMaint forma parte del ecosistema de IA de Fluke, que incluye un asistente de IA eMaint, mantenimiento predictivo impulsado por IA, previsión de inventario de piezas con IA y mucho más.