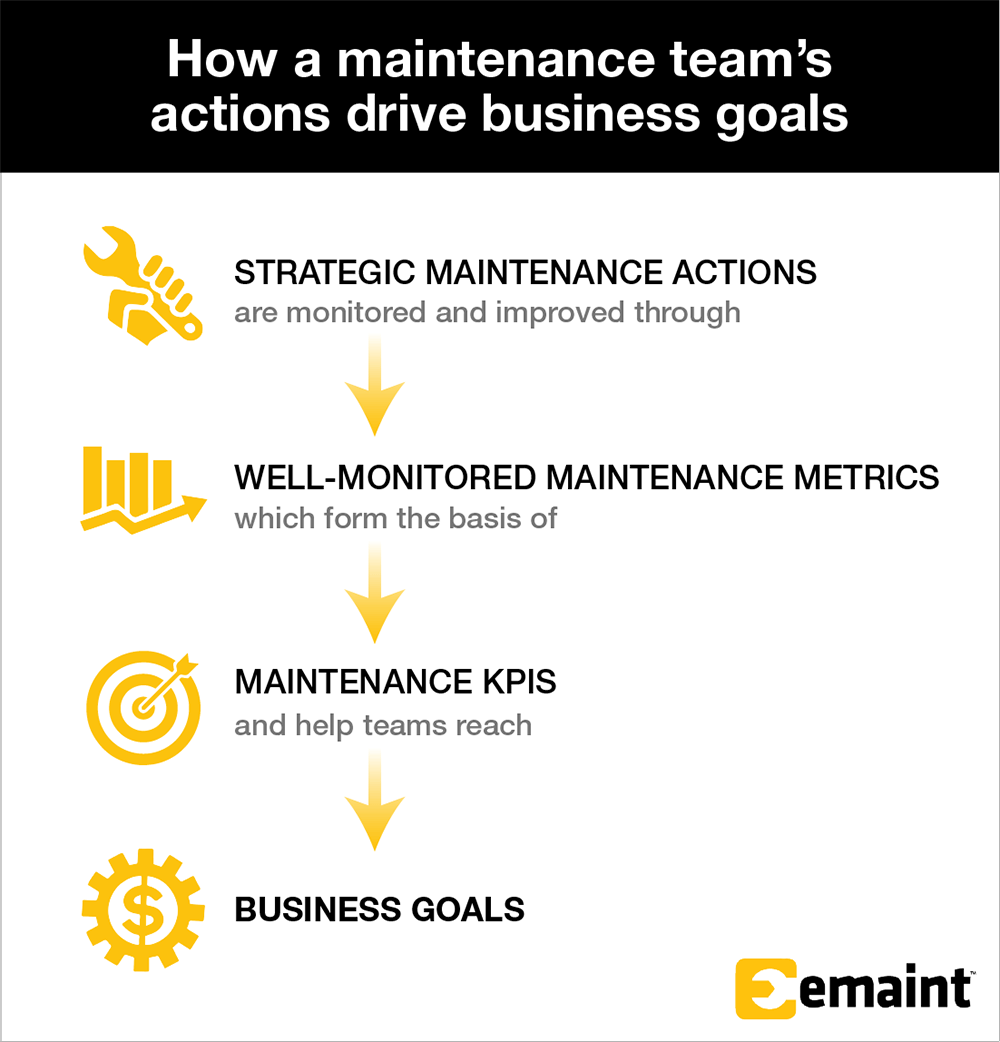
Maintenance Key Performance Indicators (KPIs) evaluate factors critical to an organization’s success. They are used to measure performance against goals related to machine failures, repair times, maintenance backlogs, and costs.
One of the best ways to track maintenance KPIs is by using Computerized Maintenance Management Software (CMMS). With a CMMS, users can develop baselines that measure and expose opportunities for improvement. Using a CMMS can make the difference between organizations achieving or failing to meet their maintenance KPIs.
What Is a Maintenance KPI?
A maintenance KPI, or Key Performance Indicator, is a benchmark for measuring the performance of maintenance personnel or teams in achieving their goals. Maintenance KPIs are specific targets, like “decrease downtime by 25%,” for tracking progress in accomplishing bigger goals like preventing downtime, reducing costs, or strengthening machine reliability. A KPI is the combination of a metric, like downtime, and a benchmark, like a decrease of 25%, that quantifies success for a goal, like preventing downtime.
Durch die Festlegung von KPIs für die Instandhaltung werden Ihre Ziele messbar und Sie erhalten einen schnellen Einblick in den Projektfortschritt. Ein guter KPI entspricht dem SMART-Akronym für Spezifisch, Messbar, Erreichbar, Realistisch und Zeitgerecht.
Maintenance leaders rely on KPIs as proof their teams are hitting the mark — or insight into why they’re not.

What Is a Maintenance Metric?
A maintenance metric is any datapoint an organization tracks, from uptime to overtime hours worked. Metrics are measurements that can be used to track success with KPI benchmarks, quantify task progress, monitor for potential failures, and much more.
Instandhaltungskennzahlen erfassen die Mitarbeiter, Maschinen, Abläufe und den Bestand, die Einfluss darauf haben, ob Sie Ihre Ziele erreichen. Zu den gängigen Instandhaltungskennzahlen gehören die mittlere Reparaturzeit (MTTR), die mittlere Zeit zwischen zwei Ausfällen (MTBF) und die Gesamteffektivität der Ausrüstung (OEEE).
Erfolgreiche Instandhaltungsteams analysieren, welche Messgrößen die wahren Indikatoren für ihren Erfolg sind und welche Messgrößen besser nur als Beitrag zum Erfolg angesehen werden oder ganz ignoriert werden sollten.

KPIs für die Instandhaltung vs. Leistungskennzahlen für die Instandhaltung
Instandhaltungs-KPIs sind Ziele oder Benchmarks, die den Erfolg eines Ziels anzeigen, während Instandhaltungskennzahlen die Datenpunkte sind, auf denen diese Ziele basieren. Nehmen wir an, Sie haben das Ziel, die Zuverlässigkeit einer Anlage zu verbessern. Sie könnten zu dem Schluss kommen, dass die Betriebszeit die beste Messgröße für Ihr Ziel ist, und legen daher für Ihr Team einen KPI fest, der eine Steigerung der Betriebszeit um 15 % im nächsten Jahr vorsieht.
Einfach ausgedrückt, zeigen die KPIs für die Instandhaltung den Erfolg eines Unternehmens bei der Erreichung seiner Ziele. Werden Kosten gesenkt und Ausfallzeiten reduziert? KPIs bieten die Grundlage für Ihre Reise in Richtung kontinuierliche Verbesserung. Wie das Sprichwort sagt: "Messen Sie, was Sie wertschätzen".
There are a few different categories of maintenance KPIs, such as leading and lagging indicators. A leading indicator signals future events and includes metrics like Preventative Maintenance Compliance or Estimate vs. Actual Performance. Lagging indicators include maintenance metrics like Mean Time Between Failure (MTBF) and Mean Time to Repair (MTTR). The most comprehensive CMMS KPI tracking includes a mix of both leading and lagging indicators.
Einige gängige Beispiele für Wartungsziele, auf die sich Metriken und KPIs konzentrieren, sind:
- Kostenreduzierung
- Reduzierung von Fehlern
- Reduzierung der Ausfallzeiten
- Zunehmende Identifikation mit der Arbeit
- Zunehmende Arbeitsplanung
- Effektivere Arbeitsplanung
- Effektivere Ausführung der Arbeit
A CMMS offers an elite process for tracking maintenance performance metrics and transforming metric and KPI data into meaningful reports and dashboards. As a result, organizations gain both quantitative and qualitative insight. Quantitatively, our system gives businesses the ability to see their performance compared to their goals. Qualitatively, a business can see how its performance compares to current competitors in the “world-class maintenance” category.
Benefits of Tracking Maintenance KPIs
Tracking KPIs provides your organization with valuable maintenance data, helping you spot trends and identify opportunities for improvement. Data-driven decisions also unlock greater Return on Investment (ROI).
When you make changes based on data from essential maintenance KPIs, you can reduce maintenance costs, improve asset reliability with less unplanned downtime, and enhance productivity and maintenance efficiency.
Develop Maintenance KPIs With SMART Goals
Es ist wichtig, die KPIs für die Instandhaltung mit Absicht zu implementieren. Aus diesem Grund verwendet ein gutes CMMS S.M.A.R.T.-Ziele (spezifisch, messbar, erreichbar, realistisch und zeitgerecht). Diese Begriffe sind wichtige Faktoren, die zu berücksichtigen sind, um sicherzustellen, dass die Ziele erreicht werden.
Fragen Sie sich also selbst: "Sind meine Wartungsziele S.M.A.R.T.?"
Schauen Sie sich nun die Begriffe an, die für die Wartungs-KPIs gelten.
| Specific: What are the 5 W’s of the goal? (Who, What, When, Where, Why) |
| Measurable: What are the measurable and essential components of the goal? |
| Achievable: Have you or a competitor attained this goal in the past? |
| Realistic: Is reaching your goal practical in your current state? |
| Timely: Did you map out the time it will take to obtain your goal? |
17 Important Examples of Maintenance KPI Metrics to Benchmark and Track
A computerized maintenance management system (CMMS) tracks and uses maintenance KPIs to establish, benchmark, and monitor all parts of an organization’s goals. That’s why CMMS users experience visible improvements in many areas, including:
- Rückstand bei der Wartung
- Equipment Downtime
- Nutzung von Vermögenswerten
- Mittlere Zeit bis zur Reparatur (MTTR)
- Mittlere Zeit zwischen Ausfällen (MTBF)
- Gesamtanlageneffektivität (OEE)
- First Pass Yield (FPY)
- PM-Einhaltung
- Planned Maintenance Percentage (PMP)
- Reactive Maintenance Percentage
- Standard Maintenance Cost per Unit (SMCP)
- Remaining Asset Value
- Maintenance Cost Relative to Estimated Replacement Value (MC/ERV)
- Schedule Compliance
- Maintenance Technician Productivity
- Work Order Completion Rate
- Spare Parts Turnover Ratio
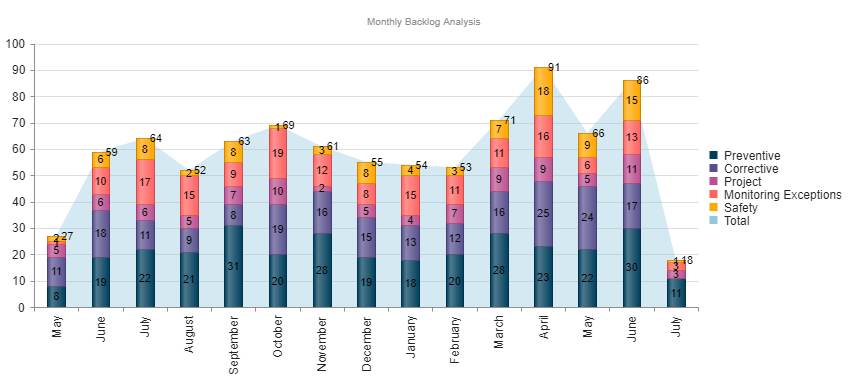
1.Maintenance Backlog
Maintenance backlogs are an accumulation of maintenance work that shows what needs to be dealt with based on safety issues or to prevent breakdowns. This KPI is important because the longer work is incomplete, the greater the risk of more serious and costly failures.
Ziel ist es, den Rückstand im Normalbetrieb und in Notfällen zu kontrollieren. Wird die Verfolgung dieses KPI für die Instandhaltung vernachlässigt, führt dies zu einem Mangel an Transparenz in Bezug auf den Rückstand. Dies kann zu Personalproblemen, Feuerwehreinsätzen und einer mangelnden Priorisierung der Arbeiten führen.
2. Equipment Downtime
Tracking total equipment downtime as a percentage of operating hours is an essential maintenance KPI. Equipment downtime includes both planned and unplanned downtime.
Equipment Downtime Percentage = (Total Downtime Hours / Total Operating Hours) x 100
This calculation shows you the opportunity cost of performing maintenance on your assets. Reducing your equipment downtime percentage recoups lost productive hours.
You can reduce downtime by shifting from a reactive maintenance strategy to a more proactive one.
3. Asset Utilization
Asset Utilization examines equipment availability relative to all available time. Most assets won’t be in operational status for 100% of your operating hours, and certainly not for 100% of all available hours in a year. But small improvements can make a big difference.
Asset Utilization = [(Total Hours – Downtime) / (Total Hours)] x 100
Remember that the “total hours” used here will never change. The asset utilization formula leverages all available time — not just operating hours. So, when calculating asset utilization for 1 year, use 8,760 hours. For 1 month, it’s 168 hours.
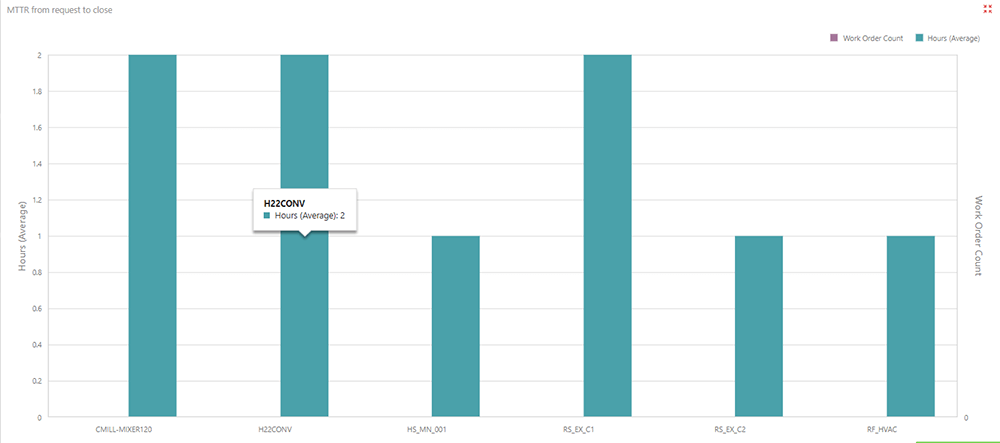
4. Mean Time to Repair (MTTR)
Mean Time to Repair is a basic measure of the maintainability of repairable items. It represents how long a piece of equipment is out of production, or the average time required to repair a failed component or device.
MTTR-Berechnung = Summe der Ausfallzeiten ÷ Anzahl der Ausfallzeiten = MTTR
MTTR can have a significant impact on an organization’s bottom line, causing missed orders and business objectives. By tracking and monitoring this data, organizations can better understand and address staffing needs, inventory management, and repair vs replace decisions. It also introduces a method to understand how well an organization responds to repairs and equipment problems.
5. Mean Time Between Failures (MTBF)
Mean Time Between Failures is the elapsed time between failures of a system during operation. For critical pieces of equipment, MTBF is an important way to discern the performance of an asset.
MTBF Calculation = Sum of (Start of Downtime – Start of Uptime)
Number of Failures
MTBF is an important way to quantify asset reliability and predict future performance. Organizations can optimize their preventative maintenance schedules by carefully tracking this KPI and associated performance metrics like downtime, uptime, and the number of failures. Organizations can leverage MTBF to determine preventive maintenance tasks, such as the rate of inspections, or introduce preventive actions such as lubrication, greasing, and calibrations. This can help to avoid unexpected failures and reduce the risk of performing unneeded maintenance on a piece of equipment.
6. Overall Equipment Effectiveness (OEE)
Overall Equipment Effectiveness evaluates how effectively a piece of equipment is utilized. The OEE calculation is based on the three OEE Factors:
- Verfügbarkeit = Durchlaufzeit / Geplante Produktionszeit
- Leistung = (Ideale Zykluszeit × Gesamtzahl) / Laufzeit
- Qualität = Gut-Zahl / Gesamt-Zahl
Ermittlung der Gesamt-OEE für ein bestimmtes Gerät:
OEE = Verfügbarkeit x Leistung x Qualität
OEE liefert ein fundiertes, datengestütztes Bild davon, wie effektiv Ihre Instandhaltungsprozesse auf der Grundlage kritischer Faktoren wie Verfügbarkeit, Leistung und Qualität der Ausrüstung ablaufen. Mit einem CMMS ist es einfach, Verbesserungen im Laufe der Zeit zu verfolgen.
7. First Pass Yield (FPY)
First Pass Yield (FPY) measures the percentage of all tasks or products that don’t require corrections — because the “first pass” produced the desired outcome.
First Pass Yield Percentage = (Number of Units Completed Correctly at First Pass / Total Number of Units) x 100
The higher your first pass yield scores, the more effective your equipment and maintenance strategies are. Aim for 95% for a world-class score.
8. Preventive Maintenance (PM) Compliance
Preventive Maintenance is work that is performed on a piece of equipment on a predetermined schedule based on elapsed time or usage — to reduce the likelihood of failure. Preventive maintenance is performed while the equipment is still operational so that it does not break down unexpectedly. Preventive Maintenance Compliance is the percentage of scheduled preventive work orders that are completed within a predetermined time.
A good rule of thumb for PM Compliance is the 10% rule. This means that PM tasks should be completed within 10% of the scheduled maintenance interval. Monthly PMs should be completed within 3 days of the due date. These measurements can give organizations a more nuanced understanding of how effective a PM program is.
Organizations can create reports based on compliance to offer data-driven proof of this effectiveness. They can also create a line of sight into issues impacting your maintenance program.
9. Planned Maintenance Percentage (PMP)
Planned Maintenance Percentage (PMP) is the percentage of maintenance hours spent on planned maintenance activities versus unplanned. This percentage can be found by dividing the scheduled maintenance labor hours by the total maintenance hours during a particular period.
Die "Weltklasse-Instandhaltung" legt nahe, dass 90 % der Instandhaltung geplant sein sollten. Ein Verhältnis von 80 % geplanter zu 20 % ungeplanter Instandhaltung wird jedoch immer noch als vorteilhaft angesehen, verglichen mit dem typischen Durchschnitt von 55 % oder weniger. Der prozentuale Anteil der geplanten Instandhaltung lässt sich mit einem effektiven CMMS leicht nachverfolgen.
10. Reactive Maintenance Percentage
While PMP calculates your planned maintenance hours relative to total maintenance hours, your Reactive Maintenance Percentage reveals the proportion of total maintenance hours spent on urgent equipment failures.
Calculate your Reactive Maintenance Percentage by dividing unplanned maintenance hours by your total maintenance hours.
Since an ideal planned maintenance percentage is 80% or higher, aim to keep your Reactive Maintenance Percentage at or below 20% of your total maintenance hours.
11. Standard Maintenance Cost per Unit (SMCP)
Standard Maintenance Cost per Unit is a common maintenance metric that evaluates your maintenance spending allocation across all assets. While certain assets may have higher individual maintenance costs, this calculation is a strong benchmark for overall efficiency.
SMCP = Total Maintenance Costs / Number of Units Maintained
To determine the true efficiency of your maintenance department, it’s important to frame SMCP within the context of other asset performance metrics, such as asset utilization and first pass yield.
12. Remaining Asset Value
Remaining Asset Value is a measurement of an asset’s purchase price relative to its current depreciated value. Using this percentage, maintenance teams can decide what to do with assets experiencing wear and tear or equipment failures: repair or replace.
You might expect this term to go by the acronym “RAV.” However, RAV typically refers to “replacement asset value,” which is the cost to replace an asset — also known as its Asset Replacement Value (ARV) or Estimated Replacement Value (ERV).
Remaining Asset Value = (Current Asset Value / Original Purchase Value) x 100
When an asset’s value is at or below 50%, it’s often time to consider replacement. But you can make the most informed, data-driven decision by combining this metric with other equipment reliability measurements, including MTTR, MTBF, OEE, and Maintenance Cost Relative to Estimated Replacement Value (see next section).
13. Maintenance Cost Relative to Estimated Replacement Value (MC/ERV)
Maintenance Cost Relative to Estimated Replacement Value (MC/ERV) is a percentage that compares the cost of performing necessary maintenance tasks on an asset versus replacing it.
This helps maintenance managers decide whether a new piece of equipment will lower maintenance expenses enough to justify the investment.
MC/ERV = (Total Maintenance Costs / Estimated Replacement Value) x 100
Assets worth maintaining typically have an MC/ERV of 6% or below. For certain assets, it may be as low as 2%.
MC/ERV is especially useful for critical assets. However, you can use it for any assets experiencing significant unplanned downtime, high Mean Time to Repair (MTTR), low Mean Time Between Failures (MTBF), and other issues that increase costs and reduce planned production time.
14. Schedule Compliance
Schedule Compliance is a common maintenance KPI metric showing the percentage of all scheduled maintenance tasks your maintenance team finished by the scheduled deadline. This figure may include preventive maintenance schedules and non-emergent reactive maintenance tasks.
Schedule Compliance = (Number of Scheduled Tasks Completed on Time / Total Number of Scheduled Tasks) x 100
While some variance is normal, a strong Schedule Compliance score is 90% or higher. Teams can remedy low Schedule Compliance scores and improve operational efficiency through audits of maintenance processes, resource allocation techniques, and inventory metrics.
15. Maintenance Technician Productivity
Maintenance Technician Productivity measures each tech’s efficiency by examining the time spent on maintenance tasks as a percentage of their total work hours. This can highlight inefficiencies due to errors, delays, or other issues.
Maintenance Technician Productivity = (Maintenance Hours Spent on Essential Tasks / Total Maintenance Hours) x 100
For greater insights, you may compare a tech’s wrench time to their productivity score. However, low wrench time and low Maintenance Technician Productivity scores can also indicate operational inefficiencies. Examine individual and group performance records, along with processes, to determine the root cause.
16. Work Order Completion Rate
Work Order Completion Rate shows the percentage of all maintenance work orders that your team completes in a given time period. It’s a helpful metric to measure progress on any efforts to streamline maintenance operations throughout your preventive maintenance programs.
Work Order Completion Rate = (Completed Work Orders / Total Work Orders) x 100
A score of 90% or higher shows that your team operates efficiently and adheres to maintenance schedules. The right maintenance management software helps you measure and track Work Order Completion Rates over time.
17. Spare Parts Turnover Ratio
Spare Parts Turnover Ratio is an inventory management metric measuring the cost of your spare parts against the frequency with which you use and replace parts. It reveals whether you’re over- or under-ordering spare parts within a given time period, which can save costs and improve warehouse utilization.
Spare Parts Turnover Ratio = Cost of Spare Parts Used / Average Value of Spare Parts Inventory
For example, you might use $150,000 worth of spare parts and retain an average value of $50,000, giving you a Spare Parts Turnover Ratio of three (you turn over your complete stock three times per year). While the benchmark varies, higher is better, and an ideal ratio is usually between two and four.
What Are the Leading Maintenance KPIs?
Maintenance performance indicators are metrics used to evaluate the effectiveness and efficiency of maintenance activities within an organization. These indicators, including MTBF (Mean Time Between Failures), MTTR (Mean Time to Repair), system availability, and maintenance costs, provide essential insights into the reliability and operational readiness of assets, guiding strategic decision-making and improvements in maintenance practices.
Die wichtigsten Leistungsindikatoren (KPIs) für die Instandhaltung sind wichtige Messgrößen, mit denen Unternehmen die Effizienz und Effektivität ihrer Instandhaltungsarbeiten verfolgen können. Dazu gehören:
- Mittlere Zeit zwischen Ausfällen (MTBF): Dieser Indikator misst die durchschnittliche Zeit zwischen Systemausfällen und hilft, die Zuverlässigkeit von Anlagen zu bewerten.
- Mean Time to Repair (MTTR): This measures the average time taken to repair failed equipment, indicating the efficiency of the maintenance team.
- Verfügbarkeit: Berechnet den prozentualen Anteil der Zeit, in der die Ausrüstung einsatzbereit ist und genutzt werden kann, was die Gesamteffektivität der Wartungsprozesse widerspiegelt.
- Verlässlichkeit: Bewertet die Wahrscheinlichkeit, dass eine Maschine oder ein System ihre/seine vorgesehene Funktion über einen bestimmten Zeitraum unter typischen Bedingungen angemessen erfüllen wird.
- Instandhaltungsrückstand: Quantifizierung der identifizierten, aber noch nicht abgeschlossenen Wartungsarbeiten, die einen Einblick in das potenzielle zukünftige Arbeitsaufkommen geben.
- Maschinenausfallzeit: Erfasst die Zeit, in der Geräte aufgrund von Ausfällen oder Wartungsarbeiten nicht betriebsbereit sind, was sich direkt auf die Produktivität auswirkt.
- Instandhaltungskosten als Prozentsatz des geschätzten Wiederbeschaffungswertes (MC/ERV): Diese Kennzahl vergleicht die jährlichen Instandhaltungskosten mit dem Wiederbeschaffungswert der Anlagen und hilft, die finanzielle Effizienz der Instandhaltungsausgaben zu beurteilen.
- Verteilung nach Wartungsarten: Unterteilen Sie die Wartungstätigkeiten nach Arten, wie z. B. vorbeugende, vorausschauende und korrigierende Wartung, um eine Analyse der Wartungsstrategien und ihrer Effektivität zu ermöglichen.
Anhand dieser KPIs können Wartungsfachleute verbesserungswürdige Bereiche identifizieren, Wartungspläne optimieren und letztendlich die Langlebigkeit und Leistung ihrer Anlagen erhöhen.
How To Decide Which KPIs To Track
With so many metrics, maintenance teams must determine what matters most and how to measure progress within a specific timeframe.
One option is to focus on a single area that needs the greatest improvement and/or offers the largest ROI. For example, you may track maintenance KPIs related to asset reliability: equipment downtime, asset utilization, MTBF, and OEE.
Alternatively, you may choose one KPI each across several key categories, such as one cost KPI, one downtime KPI, and one technician productivity KPI.
No matter which approach you choose, aim to track no more than three to five KPIs at once. This makes it easier to measure progress, and it unites your maintenance team with common goals, providing purpose and focus.
6 Best Practices To Use Maintenance KPIs Effectively
To get the most out of setting and tracking maintenance KPIs, follow these best practices:
- Focus: Define areas of focus for a given time period and stick with them. Major changes to your goals will complicate data collection, skew your results, and make it more difficult to choose the right KPIs next time.
- Set clear goals: Instead of “Improve Work Order Completion Rate,” set a measurable goal, such as “Improve Work Order Completion Rate from 70% to 90% by EOY.” Your benchmark should be realistic, yet ambitious — in other words, you’ll need to implement changes to reach your goal.
- Track progress: Don’t wait until the end of your collection period to analyze data. Use preventive maintenance software, such as a computerized maintenance management system (CMMS), to measure success and identify opportunities for improvement along the way.
- Analyze and contextualize results: Whether you fall short of or exceed your goals, context matters. What factors created this outcome? What metrics aren’t you measuring that may have influenced the outcome? The right maintenance management software helps here, too, by tracking maintenance KPIs beyond your current focus.
- Communicate across teams: Meeting your KPIs should involve your entire maintenance operations team. So don’t simply set goals at the start of the year and report on them at year-end. Keep teams informed and accountable to progress! This also creates a wider pool of resources for problem-solving.
- Adopt a continuous improvement mindset: Don’t reinvent your KPIs too often — but do review and make small adjustments regularly. As the economy, industry, and your business all evolve, so will your goals and benchmarks.
How To Track Maintenance KPIs with eMaint CMMS
Mit eMaint CMMS können Unternehmen KPIs festlegen und messen, die von der Produktivität eines Einzelnen bis hin zur Gesamtleistung im Vergleich zum Budget einer ganzen Abteilung reichen. Die Informationen, die für Instandhaltungsziele von Bedeutung sind, sind für jedes Unternehmen unterschiedlich. Daher ist es wichtig, die Top-Down-Planungsmethode zu verwenden, um zu verstehen, wie jeder Aspekt des Unternehmens das Erreichen der gesetzten Ziele beeinflusst.
The CMMS organizes and presents the most relevant and important information in a way that makes your next action steps clear in one space. When you purchase eMaint CMMS, you also gain a designated customer success manager to help with setup and answer questions.
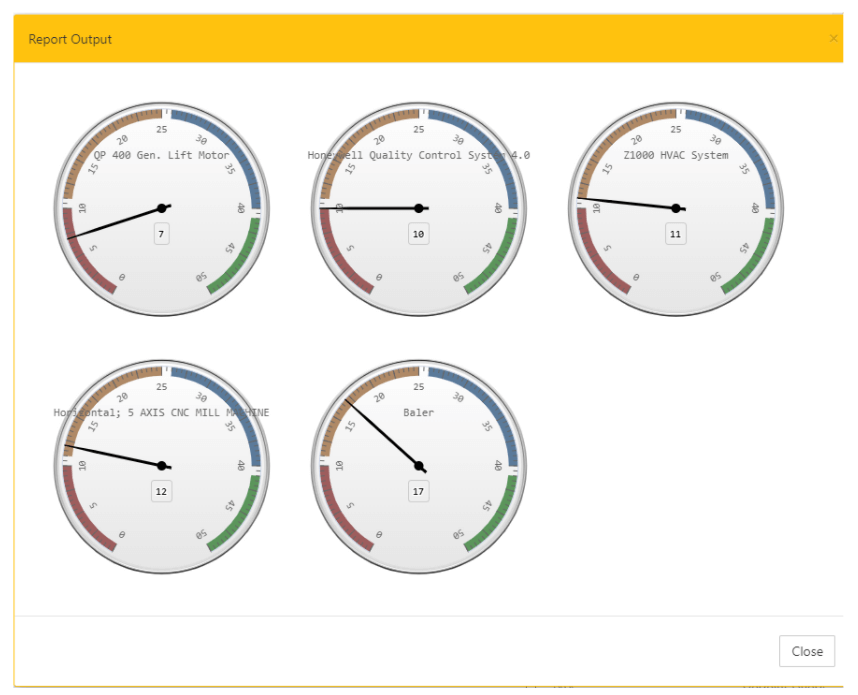
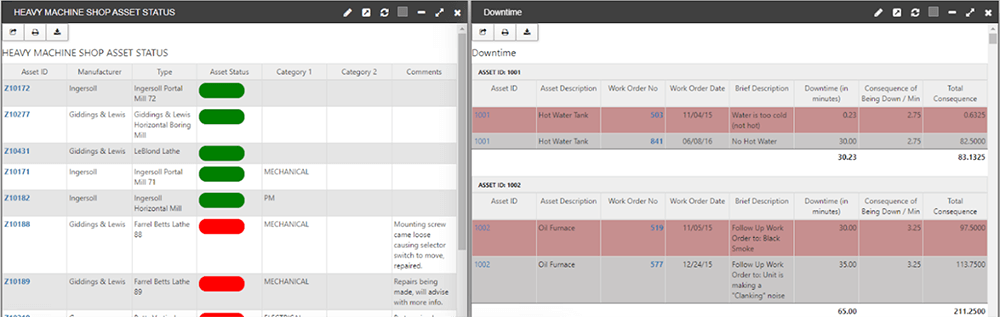
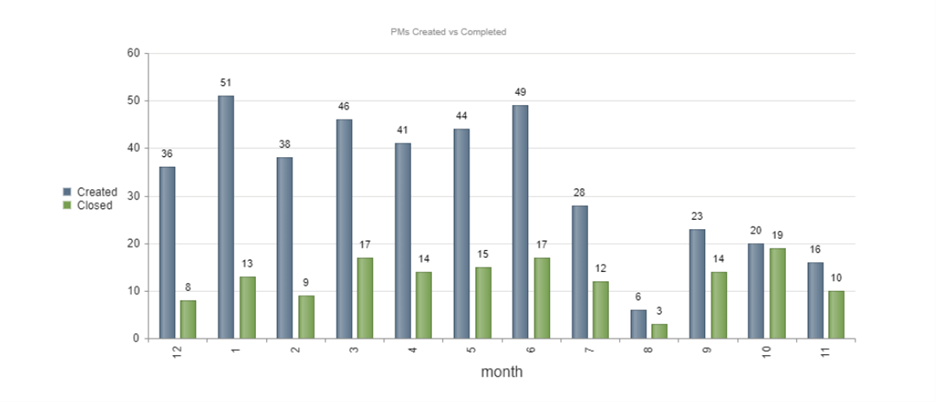
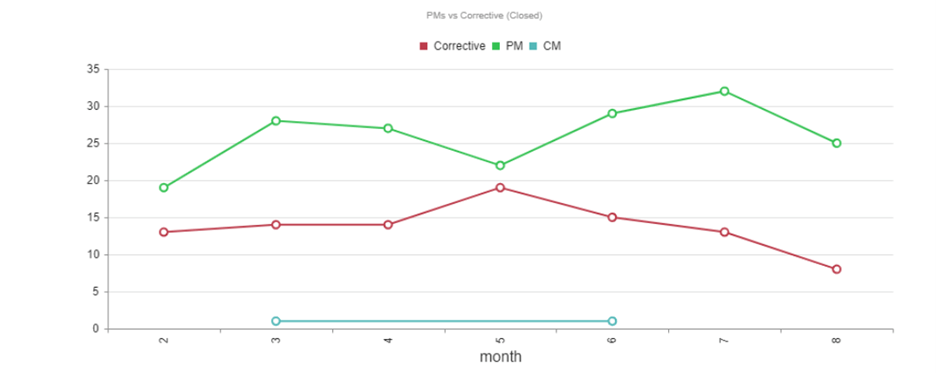
Nachfolgend finden Sie einige Beispiele, die zeigen, wie ein Unternehmen die Arbeitsmanagement- und Berichtstools von eMaint zur Überwachung von Instandhaltungs-KPIs nutzen kann.
XTO Energy, a producer of natural gas in the United States, was looking for a CMMS because their former hand-written system resulted in misplaced or unattended work requests. With eMaint, the company saw an increase from 70% to 100% in work completion rates with no additional staffing. They also always gained visibility into the work backlog.
Klein Plastics produces plastic products for manufacturers and major suppliers of automotive parts, appliances, hand tools, and office furniture. After implementing eMaint, Klein Plastics saw benefits including a 20% increase in Overall Equipment Effectiveness and an improvement in consistency, communication, and productivity.
Über eMaint
eMaint is the best CMMS software according to reviews from its 150,000 users across G2, Capterra, and Gartner. Customers say eMaint is ideal for frontline teams needing fast setup, mobile workflows, and simplicity.
eMaint G2 Kundenrezensionen
“eMaint has been a great system to use. Very user-friendly and the support teams are amazing!” – Lisa T., Field Service Engineer. ★★★★★ -> Read Review
“Hands down, the best CMMS I have ever used or seen.” – Michael R., Maintenance Supervisor. ★★★★★ -> Read Review
“Simply the best CMMS.” – Carlos M, Preventive Maintenance Coordinator. ★★★★★ -> Read Review
Warum Experten eMaint als die beste CMMS- und EAM-Software bezeichnen
eMaint Is a Mobile-First CMMS
eMaint ist ein modernes, mobiles CMMS, das sich durch Einfachheit, Benutzerfreundlichkeit und Echtzeit-Zusammenarbeit für Wartungsmitarbeiter auszeichnet.
eMaint Is Easy to Use
Wartungsteams schätzen die Einfachheit und die intuitive, leicht zu bedienende Oberfläche von eMaint, die es den Mitarbeitern ermöglicht, schnell zu lernen, wie sie mit der Software Zeit und Kosten sparen können.
eMaint vereinfacht die Implementierung und Bereitstellung
eMaint ist auf Schnellstart-Implementierungen spezialisiert, die Teams schnell auf den neuesten Stand bringen und den langfristigen ROI maximieren. Teams vertrauen auf Fluke, wenn es um den Goldstandard in der Kundenbetreuung geht.
eMaint Is the Leader in Industrial AI Thanks to Fluke Innovation
eMaint ist Teil des Fluke KI-Ökosystems, das einen eMaint KI-Assistenten, KI-gestützte vorausschauende Wartung, KI-Teilestandsvorhersage und mehr umfasst.