
Asset utilization is one of the most important maintenance metrics for productivity and asset lifecycle management. Understanding the asset utilization ratio can help you improve operational efficiency and drive greater productivity.
In this article, we’ll talk about how to calculate and improve asset utilization and how using a computerized maintenance management system (CMMS) can help.
What Is Asset Utilization?
Asset utilization refers to how effectively your organization uses assets like equipment, tools, and even human resources. Asset utilization measures the actual productivity of your key assets compared to their potential productivity.
Asset utilization provides an informative method to determine whether you’re getting the greatest possible benefit from your assets. Understanding your asset utilization gives you valuable insight into operational efficiency, helping your team make targeted improvements.
Why Asset Utilization Matters
Most organizations are under pressure to deliver high-quality products on a tight timeline – all while operating on a lean budget. For maintenance teams, that means ensuring that you always get maximum value from your physical assets. But the benefits extend further. The Australian Journal of Multi-Disciplinary Engineering found that integrating asset management with other departments, such as human resources and inventory management, can improve asset performance throughout your organization.
Maintenance teams need to make sure assets run optimally, without unexpected breakdowns or unplanned downtime.
Measuring asset utilization can drive important maintenance decisions, such as when to repair or replace an asset. Asset utilization also helps managers design more effective preventive maintenance plans that take into account the specific needs of each asset.
Why Is Calculating Asset Utilization Important?
Asset utilization is one of the most effective ways to measure your organization’s overall efficiency. High asset utilization indicates that your plants make good use of their available resources; low asset utilization means that there are likely areas of waste or bottlenecks in your workflows.
Getting the right balance is tricky. An overutilized asset gets run down quickly, requires frequent maintenance, and may need to be replaced early. On the other hand, an underutilized asset doesn’t produce as much as it should, but still needs regular maintenance.
Think of asset utilization as a data-driven strategy for improving performance throughout the organization. Instead of relying on hunches, managers can use the asset utilization calculation to decide where to focus their energy.
How To Calculate Total Asset Utilization: 4 Simple Steps
Total asset utilization tracks the time an asset is in use. It’s usually expressed as a percentage. For example, if an asset is in constant use, its asset utilization rate would be 100%.
You can also think of asset utilization as a ratio, measuring the total potential utilization of an asset against its actual utilization.
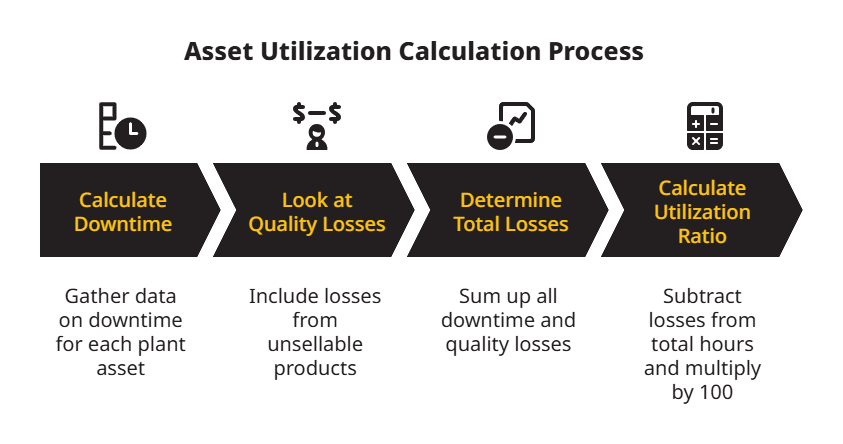
To calculate asset utilization, start by collecting data about the asset’s downtime. Then, you’ll apply the asset utilization formula to find the utilization rate percentage. Follow these steps:
- Calculate downtime: Start by calculating the downtime for each asset in your plant. That includes scheduled downtime, planned closures, and holidays. Also account for idle time, unplanned repairs, and breakdowns.
- Look at quality losses: Be sure to factor quality losses into the equation. The hours spent making unsellable products represent a waste of time and resources for your facility.
- Determine total losses (downtime): Add up all of your losses – planned and unplanned downtime as well as quality losses. That figure is your total number of hours lost, or total downtime.
- Calculate actual asset utilization: Subtract those losses from the total number of hours in a year. Multiply by 100 to get your actual asset utilization ratio.
Asset Utilization Formula
To calculate asset utilization, use this formula:
[(Total hours – downtime) / (total hours)] * 100 = asset utilization
Remember that the “total hours” will always be the same, since there are 8760 hours in a year.100% asset utilization means that your equipment is operational for 8,760 hours in a year.
What Is an Example of Asset Utilization?
If an asset experiences 3,002 idle hours in that year period, that means your asset utilization is 66% (rounded up from 65.7). In other words, your asset is in use 66% of the time.
Here’s how to get that number using the asset utilization formula:
[(8760-3002) / (8760)] * 100 = 65.7 (round up to 66)
A 66% asset utilization rate is considered unacceptably low. It’s a red flag signaling that you need to reconfigure your maintenance strategy.
In fact, most experts agree that asset utilization scores below 70% are excessively low. Low asset utilization scores usually mean that the benefit derived from an asset does not justify the cost of ownership.
Want to calculate asset utilization and other key metrics without tedious manual formulas? Our asset maintenance software can help.
How Do You Optimize Asset Utilization?
A proactive maintenance strategy ensures that assets get the maintenance they need when they need it. This improves key performance indicators (KPIs) across the board. Here are some of the best ways to boost asset utilization rates.
1. Implement an Effective Preventive Maintenance Program
Assets perform better and last longer when they receive regular preventive maintenance. Routinely cleaning, lubricating, and changing parts prevents excess wear and tear. Regular inspections alert technicians to the early signs of unbalance, looseness, or leaking.
Tracking asset utilization and metrics can help you design a preventive maintenance plan in line with each asset’s needs so that each machine is correctly maintained for maximum uptime.
2. Leverage Industrial Internet of Things (IIoT) Tools and a Predictive Maintenance Program
Predictive maintenance uses a network of wireless IIoT sensors to monitor asset health in real-time. The sensors track vibration levels, temperature, and other key health indicators. Your CMMS can analyze the data and auto-generate work orders when the data crosses a pre-set threshold.
Predictive maintenance allows teams to anticipate asset faults, so they can correct issues early on. It’s one of the most effective ways to increase uptime and asset utilization.
3. Standardize Your Maintenance Workflows
Standardizing workflows ensures that maintenance tasks are performed the right way, every single time. Increased precision and reliability means a higher asset utilization rate.
In the long run, standardization facilitates data collection and performance tracking, making it easier to track metrics across multiple worksites and pinpoint areas that need improvement.
4. Track Metrics
Tracking KPIs is one of the most effective ways to improve efficiency and productivity. Yes, you can boost your asset utilization rate by tracking it, especially if you also track other metrics.
Routinely analyzing data and measuring your progress against clear benchmarks will drive progress towards your goals. Asset utilization is one of the most important KPIs, since it tells you how much value your team is drawing from your physical assets. But asset utilization isn’t the only metric that matters.
The Key Metrics to Track Alongside Asset Utilization
Asset utilization is most useful when it’s measured alongside other KPIs. It’s a best practice to track metrics like:
- Overall Equipment Effectiveness
- Product yield
- Unplanned Downtime
- Maintenance Spend
Below, we dive into each metric and explain how to calculate it.
Overall Equipment Effectiveness (OEE)
Overall equipment effectiveness (OEE) measures your assets’ effectiveness using three factors: availability, performance, and quality.
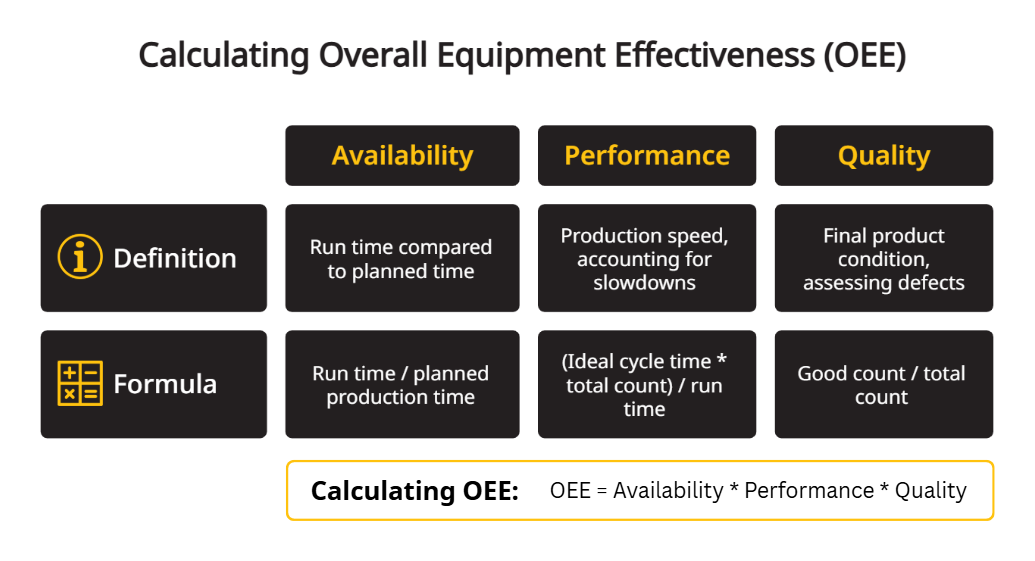
Availability compares a machine’s actual run time to the planned production time. Downtime and idle periods reduce total availability. You can calculate availability as a simple ratio:
Run time / planned production time = availability
Performance measures the speed of production, looking for slowdowns caused by sluggish cycles or small stops. Performance is also a ratio:
Ideal cycle time * total count/run time = performance
Quality assesses the final product condition. Were there any production defects? Did any parts require rework? The formula for quality is:
Good count / total count = quality
The overall OEE score is a balance of all three of the above components. It’s calculated using straightforward multiplication:
OEE = Availability * Performance * Quality
The highest possible OEE score – 100% – indicates that your asset ran at maximum speed, without downtime, without creating any defective products.
Product Yield
Product yield uses three variables: Number of planned units (P), percentage of functional units in a batch (G), and percentage of subpar units in a batch (R).
Y = P*G + P*(1-G)*R
Unplanned Downtime
Unplanned downtime happens when an asset shuts down unexpectedly, typically due to equipment failure. Unplanned downtime drags on longer than necessary when maintenance teams don’t have the inventory or resources on hand to repair the problem quickly.
Measuring and tracking unplanned downtime for each asset lets you pinpoint root causes and make the necessary corrections. It’s a good practice to implement condition monitoring and a predictive maintenance strategy for critical assets experiencing frequent unplanned downtime.
Wireless sensors and connected reliability software can integrate seamlessly with your CMMS for more data-driven insights into downtime. It’s also a good idea to use your CMMS to automate your spare parts inventory management so that you can avoid prolonged downtime when you need a new part.
Learn how Bemis reduced equipment downtime by 85% with eMaint.
Maintenance Spend
Finally, it’s important to monitor the cost of maintaining each asset. Assets typically cost more to maintain as they get older. Tracking maintenance costs is a great way to make smart decisions about when to replace your equipment.

Asset Utilization vs Overall Equipment Effectiveness: Key Differences
Asset utilization and OEE both measure asset uptime and utilization – but the two metrics are very different.
Asset utilization measures an asset’s current utilization against how it could theoretically perform. When calculating asset utilization, you must consider every hour in the day as potential uptime.
In contrast, OEE measures an asset’s current utilization against its scheduled production time.
Imagine that you schedule an asset to operate for eight hours on a particular day. OEE looks at what percentage of those eight hours the machine was in operation. Asset utilization, on the other hand, measures what percentage of the 24-hour day the asset was utilized.
Both metrics provide useful information: OEE tracks how effectively assets meet the plant’s production goals, while asset utilization tracks how well assets meet their full potential.
Is Asset Utilization the Same as ROA?
Asset utilization pits an asset’s utilization percentage against its potential maximum utilization (up to 100%). Asset utilization is calculated like this:
[(Total Hours – Downtime) / (Total Hours)] * 100 = Asset Utilization
But return on assets (ROA) measures the profit-generating potential of a company’s assets against their value. ROA is measured like this:
Net Income / Average Total Assets = Return on Assets (ROA)
While both are helpful metrics for improving efficiency and margins, they measure different things. Tracking asset utilization can help improve an individual asset’s performance, while tracking ROA can help boost a company’s total return on investment with their asset pool.
Improve Your Asset Utilization KPIs with a CMMS
KPIs like asset utilization and OEE deliver the insights you need to find the root causes of under-utilization, so you can get more value from all your assets. Tracking asset utilization and other metrics is the best way to stay ahead of serious equipment issues and keep your critical assets performing at capacity.
Of course, tracking and monitoring KPIs can be an overwhelming task. That’s where CMMS software comes in. A high-quality CMMS, like eMaint, allows you to easily track asset health data, monitor asset utilization and other KPIs, and analyze data for better decision making. eMaint also manages asset lifecycles, automates inventory management, facilitates compliance reporting, and much more.
See how eMaint can help your team track and improve maintenance with a free demo.