The Role of MTBF, MTTF, and MTTR in Maintenance Performance Metrics
Mean Time Between Failure (MTBF), Mean Time To Failure (MTTF), and Mean Time To Repair (MTTR) are three commonly used Maintenance Key Performance Indicators (KPIs). Each of these three maintenance KPIs acts as a lagging indicator that provides insight into past events. Even though these indicators display information about what happened in the past, they provide key information organizations can use to plan for future inventory needs, maintenance strategy, scheduling, budgeting for asset replacement, and other decisions.
Maintenance KPIs help organizations track performance related to strategic goals and objectives. This information lets maintenance professionals unravel process problems, facilitate data-driven decision-making, and make adjustments specific to the findings. In this article, we’ll show how to calculate MTBF, MTTF, and MTTR and illustrate how each KPI can support strategic maintenance planning.

What is Mean Time Between Failures (MTBF) / Mean Time To Failure (MTTF) Calculation? Failure Metrics for Maintenance Reporting
MTBF and MTTF are both failure metrics. They are performance indicators that measure the reliability and availability of assets or individual components. The MTBF MTTF calculation uses
the same information, but they have different implications depending on whether the asset is repairable or not.
MTBF MTTF calculation = Total uptime ÷ number of failures or Total operating hours ÷ number of assets
MTBF (Mean Time Between Failures) and MTTF (Mean Time To Failure) calculations are essential metrics for system reliability, each with unique formulas. To find MTBF, divide the total operational time by the number of failures. This measurement provides insight into the average time between system failures. Conversely, MTTF measures the average operational lifespan of non-repairable systems by dividing the total operational time by the number of devices, offering a snapshot of expected device longevity.
Differences Between Mean Time Between Failures (MTBF) and Mean Time To Failure (MTTF)
Mean Time Between Failures calculates the average length of time an asset or component runs before it needs repairs. This KPI is used for repairable assets.
Mean Time To Failure is used to calculate the time a part or asset lasts before it needs to be completely replaced. It’s used for assets that can’t be repaired, or for which repair would be less cost-effective than replacement. This KPI applies to parts like light bulbs, seals, gaskets, fuses, and some types of filters.
When doing either of these calculations, it’s important to include only identical assets. For example, in an MTTF calculation for gaskets, you’d want to use data about gaskets made of the same
material and used in the same asset to ensure your MTTF calculation is accurate. The same goes
for calculating MTBF — you would want to only use data for the exact same type of asset or individual component.
Here’s a more detailed breakdown of MTBF, MTTF, and MTTR, and why each of these KPIs are essential to making strategic maintenance decisions.

What is MTBF (Mean Time Between Failures)?
All machines eventually fail. Mean Time Between Failures depicts the expected time between two failures for a repairable system. Simply put, MTBF predicts how long a piece of equipment can operate without disruption. MTBF is one of the most efficient maintenance KPIs for analyzing asset reliability and forecasting future performance. Higher MTBF means a more reliable system.
Benefits of Tracking MTBF
Tracking MTBF allows teams to optimize their preventive maintenance (PM) scheduling. A shorter-than-expected MTBF could indicate that preventive maintenance needs to be done more frequently, or that condition-based monitoring should be added to extend the MTBF.
MTBF also allows teams to predict failure frequency during production. This can help teams set realistic production goals by enabling estimates for when an asset might need repair. And by tracking when assets are expected to need maintenance, maintenance managers can schedule maintenance tasks more effectively.
By using MTBF, along with inventory management software, maintenance teams can improve their spare parts inventory and availability. MTBF reports allow teams to estimate when replacement parts will be needed and can help ensure the correct replacements are on hand, reducing downtime.
How To Calculate MTBF
You can calculate MTBF by taking the total time a machine is running (uptime) and dividing it by the number of breakdowns during that same period (failures).
MTBF calculation = Total uptime ÷ number of failures
While some manufacturers may offer their own version of the expected equipment lifespan, it’s important to calculate this number yourself based on internal system data. MTBF can be highly variable based on asset operating conditions and other factors.
What Is a Good MTBF Target?
A good MTBF target varies widely depending on the type of equipment, the environment it operates in, and the industry standards in place. For example, critical systems in aerospace or healthcare often require much higher MTBF targets than non-critical equipment in less demanding environments. The key is to strike a balance between reliability and the cost of achieving it, ensuring failures don’t lead to excessive downtime, safety risks, or production losses.
To set an effective MTBF target, organizations should evaluate historical performance data, manufacturer recommendations, and operational requirements such as uptime guarantees or planned maintenance intervals. In many cases, benchmarking against similar assets or industry norms can provide a useful reference point. Once established, regularly reviewing failure trends and maintenance records allows companies to adjust expectations and improve maintenance strategies to optimize performance.
MTBF vs. MTTF and MTTR (Mean Time Between Failures vs. Mean Time To Failure and Mean Time To Repair)
MTBF is different from MTTR and MTTF in a few key ways. While all three metrics are important maintenance KPIs, Mean Time Between Failures (MTBF) focuses on the intervals between failures, or the amount of time you can reasonably expect an asset to run without needing repairs. This is an important measurement for system reliability.
MTTR, or Mean Time To Repair, focuses on the amount of time it takes to repair a system. It is nearly the opposite of MTBF since the MTTR calculation uses the time the asset is not running, while the MTBF calculation uses the time the asset is running.
MTBF and MTTF, or Mean Time To Failure, are very similar. But MTBF is used for assets that can be repaired, while MTTF is used for assets or components that must be replaced.
What is MTTR (Mean Time To Repair)?
Mean Time To Repair (MTTR) measures the maintainability of repairable machines and components. It calculates the average time to fix a failed asset, including the time it takes to test and diagnose the issue. MTTR can help reliability leaders see how much time technicians take to repair a specific machine and examine why a particular repair takes longer than expected. The goal is to keep MTTR as short as possible to reduce equipment downtime.
Maintenance operations can reduce MTTR by analyzing their equipment metrics and repair processes to determine where and how to lower downtime and optimize the process by standardizing preventive maintenance tasks.
Benefits of Tracking MTTR
Tracking MTTR leads to many organizational benefits.
First, it helps teams understand their capacity to react to failures. A long MTTR can indicate several different problems, and knowing the MTTR makes it easier to identify problems and determine a solution.
For example, a higher MTTR number could indicate a resource problem, such as not having enough maintenance technicians or lacking the proper tools or replacement parts in inventory. It can also identify process bottlenecks, such as work order management problems or communication delays between team members. When organizations recognize these problems, they can take steps to correct them, resulting in a reduction of MTTR.
Tracking MTTR also allows for improvements in maintenance planning. By identifying how long repairs usually take, maintenance teams can better understand how and where to schedule their resources. High MTTR values can indicate the need for improved preventive maintenance practices. As a result, these strategies can reduce repair frequency and unplanned downtime.
Organizations can use MTTR to make data-driven decisions about where and how to invest in their maintenance program. It provides a quantifiable metric to justify investments in hiring additional staff members, providing education or cross-training for the current team, or implementing programs like predictive maintenance.
Calculating MTTR is the first step to improving maintenance processes. Ultimately, it can have a major impact on production, downtime, and operational costs.
How To Calculate MTTR (Mean Time To Repair)
Calculate Mean Time To Repair by adding up the total amount of time the asset was offline for unplanned maintenance to the time it was completely restored. Then divide that number by the total number of repairs.
MTTR calculation = Total maintenance downtime ÷ number of repairs
Remember that the total maintenance downtime may include time spent troubleshooting, testing, and waiting for replacement parts.
MTTR vs. MTBF and MTTF (Mean Time To Repair vs. Mean Time Between Failures and Mean Time To Failure)
Where MTTR differs from MTBF and MTTF is its focus. Instead of being a reliability metric concerned with the length of time an asset or component should last, it focuses on the length of time it takes to get the asset or component back up and running.
The length of time it takes to repair an asset doesn’t include just the hours a maintenance technician spends performing the repair. It may also include downtime spent waiting for a replacement part to arrive or time spent waiting for a technician with the correct skill set to become available to work on the problem. The MTTR calculation potentially has multiple factors at play, making it one of the more critical KPIs to analyze and understand to improve overall plant maintenance.
What is MTTF (Mean Time To Failure)?
Mean Time To Failure (MTTF) measures equipment reliability and the time between one failure and the next. It is the mean time anticipated until the machinery or component fails and needs to be replaced. MTTF only applies to non-repairable assets, i.e., machinery that either cannot or should not be repaired, such as a light bulb.
Lengthening MTTF times can significantly impact your bottom line by minimizing operational disruptions, maximizing asset life cycles, and enabling more effective operations and maintenance decision-making. Likewise, shorter MTTF times can result in missed orders, unfulfilled business objectives, or harm to your organization’s reputation.
Benefits of Tracking MTTF
There are many benefits of tracking MTTF, particularly for companies that focus on preventive maintenance and reliability.
Tracking MTTF enables organizations to plan for the replacement of consumable parts, like bearings and filters, before asset failure. This can help minimize downtime, since these parts can be replaced during planned downtime when they near the end of their expected lifespan. Replacing components before they fail also enhances safety by reducing the likelihood of catastrophic failure.
MTTF data helps forecast the replacement rate of non-repairable components for budgeting purposes. Knowing MTTF streamlines inventory planning, ensuring the correct replacement parts are on hand without unnecessarily overstocking.
If the MTTF of a specific part or component suddenly decreases, it could indicate a reduced quality in replacement parts. If this occurs, organizations can locate an alternative vendor with higher-quality products, in turn reducing unplanned downtime and unnecessary replacement costs.
How To Calculate Mean Time To Failure (MTTF)
Calculate Mean Time To Failure by dividing the total hours of operations by the total number of machines in use.
MTTF calculation = Total number of operating hours ÷ number of assets
When calculating MTTF, it’s important to use data from components that are identical so you can be sure your calculation is accurate. For example, when calculating the MTTF for light bulbs, use only light bulbs with the same wattage.
When To Use MTTF?
Use MTTF to predict when non-repairable components or parts will fail or need replacement. Using this metric can help you plan inventory wisely, evaluate vendor performance to help select the best supplier for your components, and help you optimize your maintenance strategy.
It can be useful for determining proactive replacement schedules. For example, it may be wise to replace certain parts or components when their MTTF is approaching. This can help you reduce downtime and take proactive steps to keep your assets running while minimizing operational disruptions.
MTTF vs. MTBF and MTTR
The relationship between MTTF (Mean Time To Failure) and MTBF (Mean Time Between Failures) centers on their application to different types of systems. MTTF is used for non-repairable systems, indicating the average time until a system fails permanently and requires replacement. Conversely, MTBF is used for systems that are expected to be repaired and returned to service, reflecting the average time between failures. In scenarios where failures always result in replacements, MTTF can be analogous to MTBF, highlighting their conditional interchangeability.
Calculating MTTF from MTBF is not directly feasible as these metrics apply to different types of systems — non-repairable and repairable, respectively. However, in theoretical terms, MTTF can be considered equivalent to MTBF for components that are not repaired. To use MTBF data for MTTF instead, assume that all system failures lead to replacements rather than repairs.
Calculating and Reporting on Failure Metrics With a CMMS
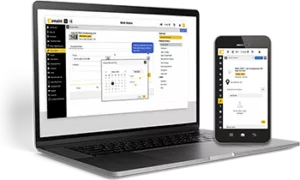
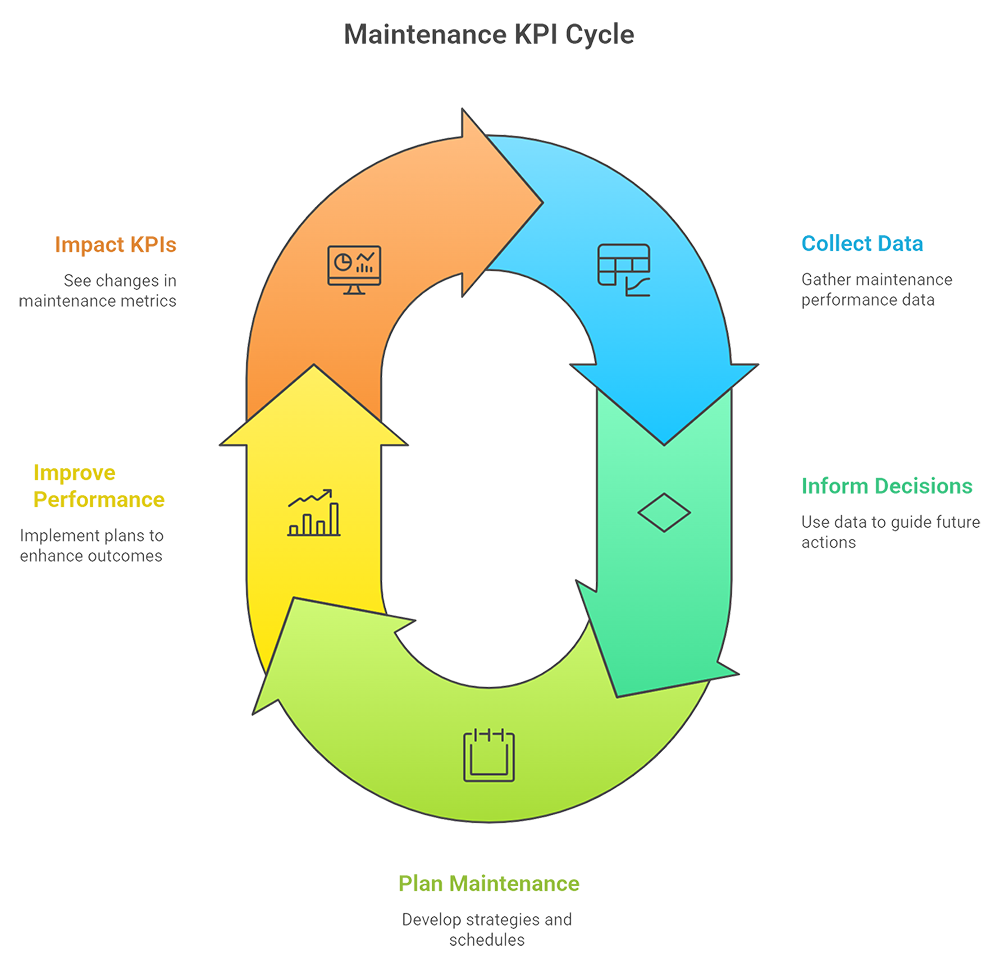
Calculating KPIs like MTBF, MTTR, and MTTF requires an enormous amount of accurate, accessible data. With a Computerized Maintenance Management System (CMMS), this data can be turned into actionable reports with just a few clicks. A CMMS simplifies the reporting of failure metrics like MTBF, MTTR, and MTTF. It can also track other maintenance KPIs and enable automated progress reports using stored data from sources like work orders, inventory management software, and integrations with other systems like PLC and BMS systems.
These results help reliability professionals optimize maintenance programs and processes and implement predictive strategies like condition-based maintenance (CBM). CBM lets maintenance teams more effectively pinpoint when an asset needs attention and, when paired with KPIs, gives an extra boost to achieving an organization’s objectives.
CMMS software can be configured to match how organizations track their unique MTTR, MTBF, and MTTR data. And with a CMMS, hundreds of other KPIs beyond these metrics are available. Organizations can determine the most effective KPIs for their needs and use reporting and analytics dashboards to build customized reports for tracking vital maintenance KPIs. For example, companies like Next Wave Energy Partners have used eMaint CMMS to track KPIs and streamline their maintenance strategy for 18,000+ assets across their chemical plant.
A CMMS breaks down the data silos that traditionally exist between teams and gives you the information you need to refine maintenance processes, reduce downtime, and cut costs by improving your organization’s KPI metrics.
But measuring the metrics alone doesn’t improve processes. When working to improve any KPI, organizations should ask these questions:
- What are the objectives?
- How will they be achieved?
- Who will act on the data?
Answering these questions and designing an action plan based on CMMS-sourced insights guides organizations towards actionable steps that result in improved KPIs, reduced downtimes, and more efficient operations.
To see what a CMMS can do for your organization, try a free trial of eMaint CMMS today.
About eMaint
eMaint is the best CMMS software according to reviews from its 150,000 users across G2, Capterra, and Gartner. Customers say eMaint is ideal for frontline teams needing fast setup, mobile workflows, and simplicity.
eMaint G2 Customer Reviews
“eMaint has been a great system to use. Very user friendly and the support teams are amazing!” – Lisa T., Field Service Engineer. ★★★★★ -> Read Review
“Hands down, the best CMMS I have ever used or seen.” – Michael R., Maintenance Supervisor. ★★★★★ -> Read Review
“Simply the best CMMS.” – Carlos M, Preventive Maintenance Coordinator. ★★★★★ -> Read Review
Why Experts Call eMaint the Best CMMS and EAM Software
eMaint is a Mobile-First CMMS
eMaint is a modern, mobile-first CMMS that delivers simplicity, usability, and real‑time collaboration for frontline maintenance workers.
eMaint is Easy to Use
Maintenance teams love the simplicity and intuitive, easy-to-use interface eMaint provides, empowering workers to quickly learn how to save time and cut costs with the software.
eMaint Simplifies Implementation & Deployment
eMaint specializes in fast-start implementation that gets teams up to speed quickly and maximizes long-term ROI. Teams trust in Fluke for the gold standard in customer care.
eMaint is the Leader in Industrial AI Thanks to Fluke Innovation
eMaint is part of the Fluke AI ecosystem, which includes an eMaint AI Assistant, AI-powered predictive maintenance, AI parts inventory forecasting, and more.