What Is a P-F Curve?
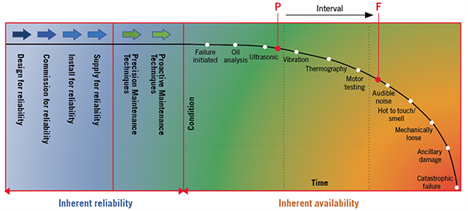
The P-F curve is a graph that helps visualize an asset’s condition to determine its practical lifespan. The most important element in the curve is the P-F interval. This is the period of time between the first point of potential failure (P) and the asset’s functional failure (F), when it no longer meets a particular standard of performance.
The P-F curve was first introduced in 1978 by United Airlines engineers Stanley Nowlan and Howard Heap. They performed a study for the U.S. Department of Defense that showed that repairing or replacing assets based on the condition was more effective than doing so based on age.
What Is P-F Analysis?
P-F analysis uses the P-F curve as a planning and visualization tool, enabling MRO teams to build a customized maintenance strategy to minimize unplanned downtime and extend the lifespan of the organization’s most critical assets. It’s a data-driven approach which allows teams to set clear goals and priorities and stay ahead of unexpected breakdowns.
The P-F curve maps out how an asset is expected to deteriorate over time. It’s a visual representation of the asset’s evolving condition, setting out clearly defined points at which the asset is at risk of a breakdown.
P-F analysis uses the P-F curve to plan effective maintenance activities. Understanding exactly when, and how, an asset is likely to fail enables teams to plan better preventive maintenance schedules. P-F analysis is also a valuable component of any proactive maintenance program. It complements approaches like condition-based
How to Read the P-F Curve
While the original P-F curve focused on detecting failure symptoms and scheduling maintenance within the interval between potential and functional failure, Fluke Reliability experts have since expanded the model. Their model begins with four asset conditions that fall under inherent reliability:
- Design for reliability
- Commission for reliability
- Install for reliability
- Supply for reliability
These early commitments, whether made by a third-party OEM or in-house engineering, play a crucial role in preventing failures before the asset even enters operation.
Past these stages, the P-F curve moves to precision maintenance techniques and proactive maintenance techniques. These are performed to ensure an asset reaches maximum inherent reliability.
Only after these preventive measures do condition monitoring tools become critical. Data gathering software like a computerized maintenance management system (CMMS) also becomes helpful at this stage for tracking machine changes. As wear accumulates, early indicators such as vibration, temperature changes, or lubricant quality begin to emerge. This is the true beginning of the P-F interval.
Importantly, functional failure doesn’t mean catastrophic failure. An asset may still be running, but not meeting operational or safety standards when it reaches functional failure. Catching problems in the P-F window allows maintenance teams to act early, reducing unplanned downtime and minimizing repair costs.
Let’s take a closer look at the most significant stages on the P-F curve.
Point P: Potential Failure
The “P” of the P-F curve refers to potential failure, which is when an asset experiences an identifiable change in its physical condition. Though a potential fault has begun to develop, the asset still runs as expected and meets performance standards.
Point F: Functional Failure
The “F” refers to functional failure, which is the point at which the asset fails to meet a predetermined performance standard. The asset may still be operational, but it is not running the way it was designed to. For example, it may run slower than it should, leading to production bottlenecks.
The P-F Interval
When an asset has passed the point of potential failure, but hasn’t yet entered functional failure, it’s in what’s known as the P-F interval. With a longer P-F interval, teams have more time to correct equipment issues and avoid breakdowns.
How the PF Curve Is Used
Maintenance teams use the PF curve to determine the condition, maintenance needs, and potential lifespan of individual assets. Here are the specific ways you can apply the PF curve:
To Visualize Deterioration
With the PF curve, you can visually represent an asset’s condition over time, defining the specific points at which the asset risks potential, functional, and catastrophic failure. This visual representation can help teams make informed, proactive maintenance decisions.
To Plan Maintenance
When you can see an asset’s projected deterioration over time, you can use that information to create a comprehensive maintenance strategy. Properly planned maintenance can extend your asset’s functional lifespan.
By mapping the points at which an asset may fail, the P-F curve helps managers build effective preventive maintenance programs, enabling them to customize interventions for each asset.
The P-F curve is also a key element in predictive maintenance programs. When used alongside predictive maintenance tools like IIoT sensors and analytic software, the P-F curve allows teams to anticipate upcoming maintenance issues and allocate resources accordingly.
To Choose Specific Maintenance Strategies, Such as Condition-Based Maintenance (CBM)
The PF curve helps you choose the right maintenance strategy for each asset. Longer PF intervals allow more time to act between potential and functional failure, which is appropriate for maintenance strategies such as condition-based maintenance (CBM). But shorter PF intervals may require more rapid intervention. To maximize the uptime of mission-critical assets, preventive maintenance may be appropriate.
To Reduce Costs
Performing maintenance tasks at Point P (potential failure) can reduce the risk of functional and catastrophic failure. Emergency repairs are often more expensive and may require replacing, rather than repairing, essential parts. But proper use of the PF curve can reduce costs by eliminating the need for excessive emergency repairs.
Effective use of the PF curve can also cut costs by eliminating unnecessary preventive maintenance tasks. Instead of planning your predictive maintenance tasks according to a rote formula, you can design a PM structure based on each asset’s P-F curve, preventing specific failure modes at specific points in time.

How to Create a P-F Curve
To create a P-F curve, begin by identifying the functional failure point — the point at which an asset can no longer perform its intended function. Then determine the earliest potential failure point, when a defect first becomes detectable. The time between these two events is the P-F interval, and the curve helps visualize how an asset’s condition degrades over time. From there, you can begin plotting the condition monitoring techniques that will help you detect deterioration over time.
One way to determine which variables to measure for different assets is to refer to the original equipment manufacturer’s instructions. They can be a valuable source for learning an asset’s most common failure indicators. The earliest detection methods tend to be more advanced, such as lab-based oil analysis or vibration signatures. Later means of failure detection can be done with simpler, non-intrusive techniques such as thermography. Once you’ve detected the mechanism and cause of failure, you can determine how to go ahead repairing or maintaining the asset.
It is possible to lengthen the time between when an asset is installed and when potential failure begins. Some maintenance teams talk about prolonging the P-F interval. If you ensure that components have the optimal fit, clearance, and alignment, you can eliminate some common types of failures to improve how assets perform.
The sooner you detect a potential sign of failure, the sooner you can schedule maintenance, and the more corrective maintenance activities can prolong an asset’s life. By combining known failure modes and proper timing of detection techniques, you can build a P-F curve that supports smarter maintenance decisions.
5 P-F Curve Variables to Use When Determining Asset Condition
The P-F curve is as relevant as ever for today’s reliability professionals. Advances in technology have allowed us to develop maintenance tools designed to gauge an asset’s health based on a variety of variables: oil analysis, ultrasound, vibration monitoring, thermography, and motor testing.
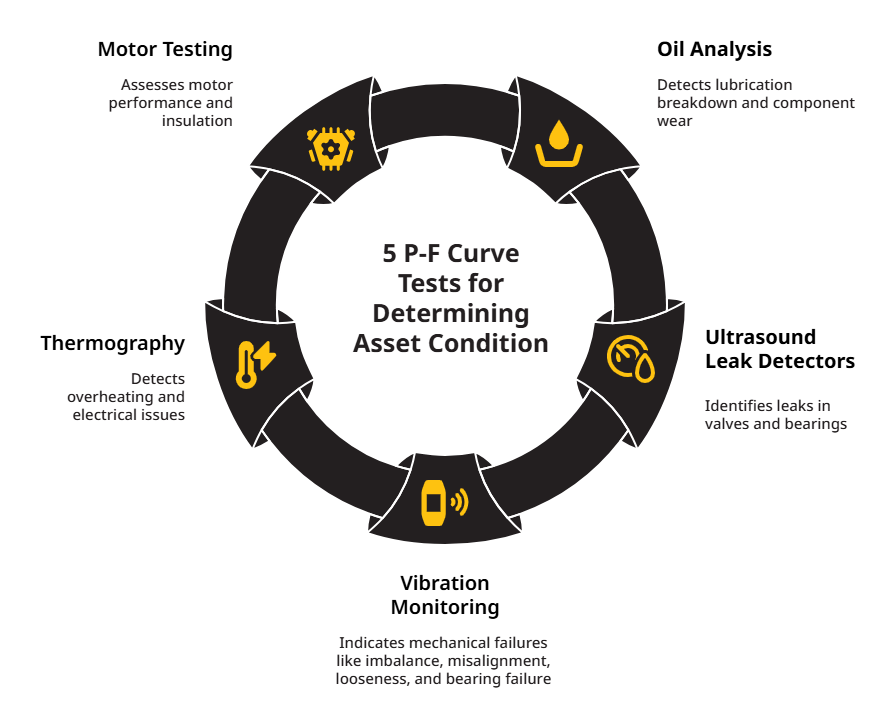
Here are the variables, presented in order from early on in an asset’s lifespan to later.
1. Oil Analysis
Oil analysis can determine the presence of lubrication breakdown, overheating, and component wear. These can be indicators of gear failure or bearing and cylinder wear. Oil analysis is commonly used on gearboxes, compressors, and other moving or rotating parts.
Oil analysis is an advanced method and may require a lab analysis for diagnosis. Teams can also take oil temperature measurements for analysis. This method is more straightforward but less conclusive.
2. Ultrasound Leak Detectors
Ultrasound can detect sounds that human ears can’t. Ultrasonic leak detectors can pinpoint problems with valves, steam traps, bearings, or potential electrical safety hazards.
3. Vibration Monitoring
Vibration is one of the most common and accessible methods of tracking an asset’s condition. Vibration monitoring can indicate four of the most common mechanical methods of failure: imbalance, misalignment, looseness, and bearing failure. It can also spot other, less-common failures.
Vibration monitoring offers the ability to screen less critical equipment while performing time-based preventive maintenance. If a problem arises, teams can perform vibration monitoring or analysis to get to the root of the issue.
4. Thermography
Thermography is recommended for time- or fault-based inspection routes, because after an asset overheats, it’s likely that it will also be damaged. Thermography tools can detect electrical and mechanical problems that have caused an asset to overheat, such as from misalignment, gearbox, or belt problems.
5. Motor Testing
Motor testing comes in handy later in an asset’s lifespan. Teams can perform different types of tests on motors depending on whether they are in operation. Insulation degradation, power factor, and harmonic distortion are all issues best detected while the motor runs. Other tests look at a motor’s speed, torque, power, and efficiency.
Why the P-F Curve Matters for Maintenance Teams
Integrating the P-F curve into your maintenance strategy offers several important advantages. It not only helps visualize how asset conditions deteriorate over time, but also provides a structured way to prioritize maintenance activities.

Here are a few key benefits:
- Increased equipment reliability: By identifying and addressing problems during the P-F interval, maintenance teams can prevent failures before they impact operations.
- Reduced unplanned downtime: Early detection gives you more time to plan interventions around production schedules, avoiding costly disruptions.
- Optimized maintenance resources: The P-F curve helps teams focus their efforts where they matter most, minimizing unnecessary inspections and part replacements.
- Improved asset lifecycle management: When combined with condition monitoring data, the P-F curve supports smarter decisions about when to repair, refurbish, or replace assets.
- Stronger justification for investment: Clear visualization of failure progression can help maintenance managers make a business case for tools like vibration sensors, oil labs, or thermal imagers.
The P-F curve is a strategic tool, and a technical best practice that aligns maintenance activities with overall business goals.
Does the P-F Curve Account for Every Possible Variable?
The short answer is no — the P-F curve does not account for every factor that can impact asset health. The P-F curve illustrates the process of machine deterioration under normal conditions. However, there are some variables that can change the P-F interval, either speeding up or slowing down the machine’s rate of deterioration.
It’s important to understand the limitations of the P-F curve so you can plan your MRO schedules accordingly, ensuring that you perform maintenance when it’s most needed.
Factors That P-F Curve Doesn’t Account For
The P-F curve does not account for the following variables:
Unexpected Operating Conditions
The P-F curve is calculated based on standard operating conditions. If your operating conditions change significantly, you can expect to see a change in the machine’s rate of deterioration.
Overworked and overloaded assets will experience premature wear and may break down earlier than expected. Likewise, uneven loads can put more strain on equipment, leading to increased maintenance needs and earlier-than-expected failure.
Environmental Factors
Operating under extreme environmental conditions can impact an asset’s deterioration rate. Unusually high or low temperatures, high humidity levels, or prolonged exposure to dust and contaminants can all shorten the P-F interval.
Of course, some equipment is purpose-built to withstand challenging environmental conditions. The question is, are you operating your equipment in the environment it was designed for? If not, then you probably can’t rely on the standard P-F interval for that asset. It’s recommended to track asset health using condition monitoring tools.
Manufacturing Errors
Inevitably, there’s some variation in equipment quality, even when produced by the same manufacturer. That could be due to a minor difference in the production process, or a change in the material used to make the asset. Human error and environmental factors can also impact an asset’s failure rates and its overall lifespan.
That’s why it would be a mistake to solely rely on the OEM’s guidelines when planning your maintenance schedules. Make sure your maintenance strategy is also based on real-time data from your own assets. Today, advanced IIoT and data analytic tools can help you build a condition monitoring strategy that considers the real-time needs of all your critical assets.
Leveraging IIoT Tools To Improve the Accuracy of the P-F Curve
The P-F curve is still as relevant as ever — but today, state-of-the-art IIoT tools and software are extending its reach and accuracy.
IIoT sensors track asset health data in real time, enabling MRO teams to pinpoint the first signs of an emerging asset fault. The technology tracks subtle changes in vibration levels, temperature, or power quality that indicate new machine defects, long before they become serious.
That data is then used to chart a detailed, highly accurate P-F curve. Done right, this P-F curve can anticipate asset failures and enable teams to “see” machine faults coming.
This approach is at the heart of any predictive maintenance strategy. Teams use a network of IIoT sensors to continuously collect data. Sophisticated data analytic tools sift through data looking for anomalies and delivering early warnings, months head of asset failure.
Which Condition Monitoring Methods Should I Use?
Updated models of the P-F curve often feature some of these measurement methods to better identify signs of wear and damage. This helps avoid failure and extends the life of the asset.
During a webinar by Fluke Reliability, 250 maintenance and reliability professionals from around the world were asked which of the five measurement methods they have used.
Here are the percentages of attendees who reported using each method:
- Vibration monitoring/analysis: 82%
- Thermography: 69%
- Oil analysis: 66%
- Motor testing: 54%
- Ultrasound: 36%
It’s not always necessary to use all five condition monitoring methods. The right choice depends on your industry, the criticality of the asset, and how quickly a failure could impact operations.
How to Prioritize Assets for Condition Monitoring
Not every asset needs to be monitored with the same level of detail or frequency. To get the most out of your condition monitoring program, start by identifying which assets pose the highest risk to safety, production, or compliance if they fail.
You can use an asset criticality assessment to rank assets based on three factors:
- Consequence of failure: Would failure lead to costly downtime, safety hazards, environmental damage, or lost product?
- Likelihood of failure: How often does this asset fail, and what’s its historical performance?
- Detectability: How easily can you predict or detect failure using condition monitoring tools?
Assets that score high in both likelihood and consequence — and where potential failures appear with enough warning — are strong candidates for condition monitoring. In contrast, assets with low criticality or unpredictable failure modes may be better suited to run-to-failure or periodic inspection strategies.
How to Maximize the P-F Curve
Just as an effective maintenance and reliability program uses a mix of condition-based, calendar-based, and reactive maintenance, you need to apply a variety of maintenance strategies to the right assets in order to maximize the P-F curve. The overall goal is to find a combination of techniques that can extend the time from potential failure to functional failure.
The P-F Curve and Condition-Based Maintenance (CBM)
Condition-based maintenance strategies like vibration monitoring can signal when the first signs of failure creep up so that your team can fix them as soon as possible. This helps postpone functional failures and can lengthen the P-F curve as a result.
But even companies with established condition-based maintenance routines do not use them for every single one of their assets. Every organization must consider both an asset’s lifespan and the resources, such as labor hours and parts, required to prevent failures. Some assets may not be frequently used or expensive to replace. In this case, it may not be necessary to employ CBM to lengthen their P-F curve, especially if the cost of CBM outweighs the cost of replacement.
Reliability-Centered Maintenance (RCM)
Reliability-centered maintenance (RCM) is a strategy that assesses the risk and potential failures of individual assets. Teams using RCM create unique maintenance plans that prioritize preserving system function. This approach is helpful for the P-F curve because it works to prevent functional failure. Both RCM and CBM are proactive maintenance strategies, which aim to detect and fix the signs of failure as early as possible.
Advancements in condition-based maintenance tools to gauge asset health – as well as added pressures from today’s competitive business environment – have made that old standby, the P-F curve, as relevant as ever for reliability professionals in 2022.

Conclusion
Assets fail in different ways, and not all assets are equally critical to a plant’s production. Even within an asset, various components require different levels of urgency.
Therefore, combining tools and techniques is the most effective way to apply the P-F curve — one size truly does not fit all. Combined with useful data and analysis, the P-F curve can help organizations continuously improve their maintenance strategies and increase their assets’ reliability.
About the Authors: John Bernet, Gregory Perry, and Dries Van Loon
John Bernet, CMRP, is a mechanical application and product specialist with Fluke Reliability and has over 30 years of experience in preventive maintenance, predictive maintenance, condition monitoring, and the operation of commercial machinery.
Gregory Perry, CMRP, CRL, is senior capacity assurance consultant with Fluke Reliability. He has been a Certified Reliability leader with nearly two decades of experience in preventive maintenance, reliability-centered maintenance (RCM), and operational best practices.
Dries Van Loon, CRL, is sales and project manager, online condition monitoring, for Fluke Reliability, with 10 years of predictive maintenance experience. He became a certified ISO CAT 4 analyst in 2017.