 What is Overall Equipment Effectiveness (OEE)?
Overall Equipment Effectiveness (OEE) is a metric that is used to measure the productivity of an individual asset or of a production operation. This key performance indicator (KPI) provides important information to help quantify how effectively assets are being used and how efficiently production lines are running.
| Metric | Definition | Formula | Inputs | Example numbers | Example result | Notes |
|---|---|---|---|---|---|---|
| Availability | Actual operating time as a proportion of planned production time, accounting for downtime. | Run Time / Planned Production Time | Run Time, Planned Production Time | Run Time = 240 min; Planned Production Time = 300 min | 240 / 300 = 80% | Measures downtime losses. 100% means no downtime. |
| Performance | Speed at which the equipment runs compared to its ideal cycle time. | (Ideal Cycle Time × Total Count) / Run Time | Ideal Cycle Time, Total Count, Run Time | Ideal Cycle Time = 1 min; Total Count = 150; Run Time = 240 min | (1 × 150) / 240 = 62.5% | Measures speed losses from slow cycles or small stops. |
| Quality | Ratio of good units produced to total units produced. | Good Count / Total Count | Good Count, Total Count | Good Count = 120; Total Count = 150 | 120 / 150 = 80% | Measures defect and rework losses. |
| OEE | Overall measure of equipment effectiveness combining availability, performance, and quality. | Availability × Performance × Quality | Availability, Performance, Quality | 0.80 × 0.625 × 0.80 | 40% | 100% OEE means perfect availability, speed, and quality. |
What is OEE in Manufacturing?
In manufacturing, OEE is a best practices metric that helps manufacturers determine how much of their production time is actually productive. As the name suggests, calculating OEE is a method to evaluate equipment efficiency by measuring equipment against three factors: availability, performance, and quality.
Factors of Overall Equipment Effectiveness
This essential equipment effectiveness calculation takes the following key factors into account:
Availability
How long was the process actually running relative to the planned production time? Were there any planned and/or unplanned stops?
An availability score of 100% means the machine ran continuously throughout the planned production time without stopping at all.
Performance
How fast is the process relative to your ideal cycle time? Was the process slowed down by any slow cycles or small stops?
A performance score of 100% means the process ran as fast as possible relative to its ideal cycle time.
Quality
Were there any production defects? Did any parts require rework?
A quality score of 100% means there were no defects in any parts produced.
OEE
Each of the individual scores from availability, quality, and performance roll up into the overall OEE score, which takes into account the losses experienced in each area. An OEE score of 100% means that the machine ran as fast as possible, with no downtime, and no defects.

How Do You Calculate OEE?
Calculating overall equipment effectiveness (OEE) involves three key factors discussed above: availability, performance, and quality. Now, let’s put OEE into practice with the following example:
OEE Calculation Example
The OEE calculation involves three key factors discussed above: availability, performance, and quality. You may also see it referred to as the overall equipment efficiency formula, but effectiveness is more accurate.
Here’s how you calculate OEE (overall equipment effectiveness) with the OEE calculation, step by step:
Availability
Formula: Run Time / Planned Production Time = Availability %
For example, your asset was expected to run for 300 minutes, but because of an unexpected maintenance issue, it went offline for an hour for repairs. This resulted in an actual run time of 240 minutes during the planned production period.
The Result: 240 minutes / 300 minutes = 80% Availability
Performance
Formula: (Ideal Cycle Time x Total Count) / Run Time = Performance %
For example, your asset is expected to yield a total of 200 units with an ideal cycle time of 1 minute per part. The run time of the shift was 240 minutes, and the machine produced 150 units in that time.
The Result: (1 x 150) / 240 = 62.5% Performance
Quality
Formula: Good Count / Total Count = Quality %
In the last section, your machine produced a total of 150 units; however, because of errors in the process, the result was 120 good units with no defects.
The Result: 120 / 150 = 80% Quality
How to Use the OEE Formula
The overall equipment effectiveness formula takes all of these elements into account, factoring in all losses.
The Result: Availability (0.8) x Performance (0.625) x Quality (0.8) = 40% OEE

Key Components in the OEE Calculation
OEE measures three key factors, as we’ve already seen: availability, performance, and quality. But how do we measure those factors? Technicians use four key components in their calculations:
- Good count: The number of high-quality parts that are produced in the given period of time. Defective or incomplete parts don’t count towards this number.
- Ideal cycle time: The shortest possible time in which you can successfully produce one good part.
- Planned production time: The amount of time, usually measured in hours, that a particular asset is scheduled to operate.
- Fully productive time: The amount of time in which an asset produces high-quality parts without defects or stoppages.
These four components are important for tracking OEE, whether we’re using the simple OEE calculation or the more detailed, preferred OEE calculation method.
Simplest OEE Calculations vs Preferred OEE Calculation Method
At its most basic, the OEE calculation measures your equipment’s capacity to turn out high-quality products at a fast pace. The simplest way to calculate OEE overall is to use this formula:
OEE = (Good Count x Ideal Cycle Time) / Planned Production Time
In this calculation, we’re treating OEE as a simple ratio of high-quality production time to planned production time. If an asset operates at full capacity, then its OEE score will be 100%. On the other hand, if your equipment malfunctions or slows down for any reason, the OEE score will be much lower.
For example, using the information from our example above, the OEE calculation would look like this:
OEE = (120 units x 1 minute) / 300 minutes = 40% OEE
However, this gives you a simplified version of the OEE KPI. This calculation is sometimes called the effective utilization rate. While it does provide useful information, it doesn’t take availability losses, such as unplanned downtime, into consideration. It also doesn’t explain why you have a low OEE score. So, although the simplified OEE does give you a snapshot of your asset’s performance, it doesn’t provide enough data to drive a better maintenance strategy.
That’s why most teams prefer to monitor this KPI using the more complex OEE formula. The preferred OEE calculation method ends up providing more detailed information, which can help shed even more light on inefficiencies:
OEE = Availability x Performance x Quality
For example, with the information from the OEE equation above, we can see which factor drives the low OEE percentage. Then, you know where to focus your team’s time and attention so that you can increase the overall OEE score.
Benefits of Tracking OEE
The benefits of tracking OEE and other maintenance metrics include improved asset utilization and improved production quality and quantity. Organizations can monitor OEE over time to help them make informed decisions about assets and their production lines. Here are some of the ways OEE tracking can benefit an organization.
- Improved performance: Assets are expensive investments, and monitoring the OEE of each one can help organizations make changes to ensure they are using their assets in the most effective way possible.
- A way to track asset health: Tracking OEE gives you a good overall picture of the health of an asset. If a certain asset consistently has an OEE of 75% and then it suddenly drops to 55%, that could be a good indicator that something changed and should be investigated and corrected. A dropping OEE score could also indicate a need to replace an asset.
- Performance comparison: Tracking OEE allows you to compare the performance of similar assets to see where you may need to make improvements. It also allows for tracking employee performance on different shifts to see how your staff impacts productivity.
- Maximized production: OEE can help identify weaknesses or bottlenecks in your production line. Finding and correcting these will result in more uptime, improved production, and lower machinery costs.
How Does OEE Tracking Benefit Lean Manufacturing?
Lean manufacturing processes focus on minimizing waste and increasing operational efficiency. That’s exactly where OEE can help.
OEE pinpoints the areas where your organization wastes resources, whether that means time, fuel, or assets. If you monitor OEE, you’ll naturally transition to a lean manufacturing strategy.
With today’s hiring challenges and the loss of skilled experts, most organizations need to learn how to make do with a lean crew. That’s just another reason to invest time and effort into the OEE calculation. Over time, it will help your team adjust to
How Does the OEE Calculation Benefit Total Productive Maintenance?
Total productive maintenance, or TPM, is all about continuous improvement. The goal is to completely eliminate unplanned downtime by steadily improving every single aspect of the maintenance process.
It’s an ambitious goal, and OEE can help. OEE is, first and foremost, a data-driven metric that lets you measure progress towards a goal. It’s an excellent way to standardize your KPIs across multiple worksites so that your whole organization is working toward the same target, using the same benchmarks.
In other words, monitoring OEE is a useful tool for anyone trying to achieve total productive maintenance. Managers use OEE to set goals and work towards industry benchmarks; they also use OEE to record baselines at each facility and then measure progress.
Of course, OEE tracking isn’t limited to the TPM approach. It’s also useful for anyone simply trying to tighten up their maintenance workflows and reduce their unplanned downtime. No matter what your maintenance goals are, using OEE in production drives a more proactive, methodical approach to reducing downtime, increasing efficiency, and lowering costs.
What Is a Good OEE Calculation Score?
Let’s say your organization’s OEE calculation yields a score of 80%. Is that good or bad? And how do you know? The answer depends on both your own facility’s baseline (is this number an improvement or degradation compared to previous scores?) and industry benchmarks (is this number higher or lower relative to industry standards?).
Is 80% a Good OEE Score?
Yes, 80% is generally considered a very good OEE score. Anything above 85% is seen as world-class by industry standards, and most organizations fall well below this number.
However, it’s also important to consider facility baselines when determining how good or bad an OEE score is. If your team had a 60% OEE score a year ago and is now seeing 80% OEE, that would be exceptional. Even 70% would be seen as a great improvement.
You can use industry standards to set goals, but it’s also important to consider what OEE scores have historically been at your facility. Any improvement is a good thing. Boosting OEE takes time, so consider what steps your team may need to make to slowly progress toward your goals.
Current OEE Score vs Facility Baseline
As with any maintenance metric, OEE is a performance indicator that will change over time. With a CMMS software, you can easily track scores over time, pinpoint where and why production losses occur, and identify areas of focus.
Current OEE Score vs Industry Standard
The OEE industry-standard groups scores are as follows:
- 100% – Perfect
- 85% – World Class
- 60% – Typical
- 40% – Low
Anything below 60% indicates potential opportunities for improvement in all three OEE factors.
Industry Benchmarks and Setting Realistic OEE Goals
To achieve a perfect 100% OEE score, your asset or production line would need to score 100% for availability, performance, and quality. That would mean that:
- Availability: The equipment is available 100% of the time, with no stopping for adjustments, maintenance, or repairs.
- Performance: Every product was made in the ideal cycle time allotted.
- Quality: Every product made is perfect and there are no reworks or imperfections.
A score of 100% is unattainable in the real world. However, many OEE scores can be improved significantly. Knowing the availability, performance, and quality scores from the ideal OEE calculation above can help you set achievable benchmarks for your team on the factory floor.
Because of the OEE calculation method, having good scores in all three areas can still result in a less-than-ideal OEE score. For example, if your score across all three areas is 80%, your OEE score would be only 51.2%.
OEE benchmarks you set for your team should be attainable. If your OEE score is very poor, asking your team to jump from a 40% score to an 80% score is probably going to be discouraging and seem like an impossible ask. Instead, set a short-term goal to improve a few key areas over the next few months. Then, when reports and analytics reveal these goals are achieved, continue making improvements to your processes to ensure you can achieve improved OEE scores over the long term.
Knowing your scores in each area can help you home in on a few key ways to target score improvements. Even minor changes could help improve your OEE score significantly and have a positive impact on your bottom line.
The Six Big Losses and Their Impact on OEE
Once you have established a baseline of what your OEE is and how it measures up to industry standards, it’s necessary to take a look at where losses are coming from – and the biggest losses fall into six main categories. Let’s take a closer look at these:
- Breakdown losses: Occur when operations stop or machines go idle due to failures and malfunctions, such as equipment failures, jams, or unplanned maintenance.
- Setup and adjustment losses: These take place during planned downtimes for installing new equipment, upgrading existing equipment, or performing changeovers, like shutting down a production line to introduce new equipment.
- Idling and minor stoppages: Result from minor issues that cause brief pauses, such as recalibrating a machine during routine maintenance or adjusting misaligned products.
- Startup losses: Typically occur during a machine’s “warm up” period or when equipment is going through a “learning” stage. Startup losses end when the machine consistently produces quality parts.
- Reduced speed losses: Caused by equipment faltering due to age, worn-out components, poor maintenance, or misuse, which prevents the equipment from reaching maximum speed.
- Quality defects: Result from malfunctioning tooling or equipment, excessive wear and tear, or poor maintenance. Leads to defective products. The six big losses align neatly with the three major categories of the OEE calculation: availability, performance, and quality.
Specifically, breakdown losses and setup and adjustment losses fall under the category of availability. Idling/minor stoppages and startup losses both fall in the performance category. And reduced speed losses and quality defects align with the quality component of OEE.
If you’re recording low scores in one of these categories, you should start by drilling down and figuring out which of the six big losses might be impacting your score. For example, if your availability score is low, check to see whether you’re experiencing frequent asset breakdowns or whether you’re spending too much time installing and adjusting your equipment.
By addressing these six big losses, organizations can significantly improve their OEE and other maintenance KPIs like MTBF, MTTF, and MTTR, leading to more efficient and reliable manufacturing operations.

Strategies for Minimizing Losses
Improving your OEE score can be challenging, but it can be done! Here are some actions you can take to avoid each of the six common losses.
- Breakdown losses can be avoided or reduced by forecasting possible shutdown scenarios and creating a comprehensive preventive maintenance plan to help avoid them.
- Setup and adjustment losses can be improved by planning production batches to use equipment more efficiently. Using techniques such as Single Minute Exchange of Die (SMED) can help reduce the length of planned stoppages by ensuring quick transitions in the production process.
- Idling and minor stoppages can be reduced by implementing standardized processes and being sure workers have been trained to perform maintenance tasks efficiently and effectively. Where possible, have workers fix simple issues in real time to avoid major breakdowns.
- Startup losses can be minimized by accounting for their impact on production lines. Develop and document best practices for machine startup and changeovers, and perform pre-run checks of lubrication, alignment, and calibration before beginning production.
- Reduced speed losses can be avoided by replacing worn and damaged equipment as soon as possible. Machine operators should be trained on proper maintenance and repair techniques to ensure assets are running as effectively as they can.
- Quality defects can be avoided or reduced by replacing old equipment in a timely manner to ensure production quality remains high. Workers should be trained to follow standard operating procedures and learn how to spot problems quickly, before they have a serious impact on production quality.
Challenges With Improving Your OEE
Now, losses incurred towards your OEE are rectifiable – but they come with certain challenges, which can be categorized as follows:
1) Data Collection Challenges
- Data Availability and Accessibility: Accessing real-time production data from equipment or integrating data from different sources can be challenging. Legacy equipment might lack the necessary sensors or connectivity to provide real-time data. Also, disparate data sources and systems might require integration efforts to consolidate information for OEE analysis.
- Data Collection and Accuracy: Accurate and timely data collection is crucial for calculating OEE. However, organizations might face challenges in collecting data consistently and reliably. Issues such as manual data entry, reliance on operator input or inadequate data tracking systems can lead to data inaccuracies or incomplete information, affecting the reliability of OEE measurements.
2) Expertise Challenges
- Understanding OEE Metrics: Interpreting OEE metrics and understanding their implications can be challenging for organizations. Without proper training and knowledge, it can be difficult to identify the underlying causes of low OEE, prioritize improvement efforts and implement effective solutions. Education and training on OEE metrics and their interpretation are essential for successful implementation.
- Equipment Complexity and Variability: Modern production equipment can be complex and highly variable, with different modes, setups or configurations. Managing OEE for such equipment can be challenging, as different operating conditions might result in different OEE values. Accounting for equipment variability and developing standardized OEE metrics that can capture various equipment configurations can be a complex task.
3) Policy Challenges
- Organizational Alignment and Culture: Implementing OEE improvements requires organizational alignment and a culture that supports continuous improvement. Resistance to change, lack of buy-in from employees or a culture that prioritizes short-term productivity over long-term efficiency can hinder OEE initiatives. Overcoming these challenges requires effective communication, employee engagement and a focus on promoting a culture of continuous improvement.
- Identifying and Addressing Root Causes: Determining the root causes of low OEE can be challenging, as multiple factors might contribute to inefficiencies. It requires a systematic approach, data analysis and collaboration among various stakeholders, including operators, maintenance personnel and process engineers. Identifying the underlying issues accurately is crucial for implementing effective corrective actions.
4) Sustainability Challenges
- Balancing Tradeoffs: Improving one aspect of OEE (availability, performance or quality) can sometimes lead to tradeoffs in other areas. For example, increasing production speed (performance) might result in higher defect rates (quality). Organizations need to carefully balance these tradeoffs and consider the overall impact on OEE and customer satisfaction.
- Sustaining OEE Improvements: Achieving initial improvements in OEE is a significant accomplishment, but sustaining those gains can be challenging. Without a focus on continuous monitoring, performance management and ongoing improvement efforts, OEE can decline over time. Sustaining improvements requires a commitment to ongoing measurement and analysis.
By recognizing and addressing these challenges proactively organizations can overcome obstacles and achieve successful OEE implementation, leading to sustained improvements.
OEE Implementation Guide for Your Organization
When implementing OEE, it’s essential to take a strategic approach. Here’s how to smartly and safely implement OEE in your operations.
Generate awareness and buy-in. No matter how strategic your plan looks from the top, your team won’t adopt what they don’t understand. Create an organization-wide education initiative to explain OEE and why it will make a difference for your team.
Get specific about OEE metrics. Before implementation, you should be clear on how Availability, Performance, and Quality are defined and measured within your operations.
Set a baseline to build upon. Calculate OEE with current stats; you’ll use today’s data as your benchmark.
Design achievable goals. What’s a realistic target for improving OEE, and by when can you achieve it?
Collect and organize data. For effective data collection and analysis, you need the right tools. A CMMS can help.
Adopt a continuous improvement approach. As you review OEE data, use what you learn to make regular updates. Incremental changes aren’t mistakes — they’re signs of progress.
Improving OEE With a Computerized Maintenance Management System (CMMS)
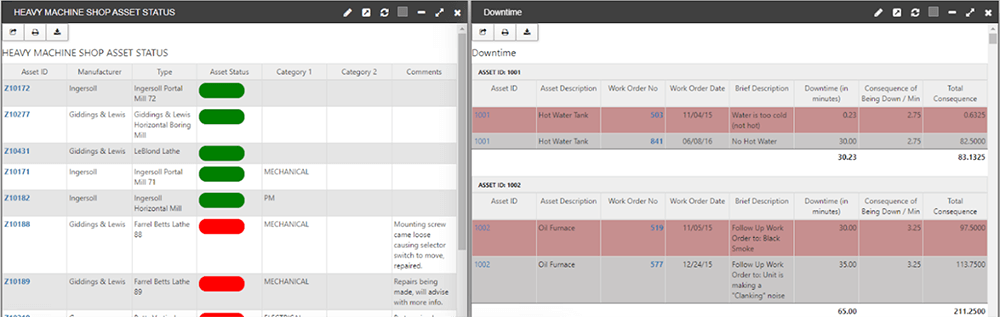
One of the best ways to track maintenance KPIs such as OEE is by using computerized maintenance management system (CMMS) software. With a CMMS, you can easily establish baselines, measure performance, and identify opportunities for improvement. Using a CMMS such as eMaint can be the difference between your organization exceeding or falling short of its maintenance KPIs.
Contact us to learn more about how eMaint can help you improve your maintenance KPIs.