What is Criticality Analysis?
Criticality analysis is a systematic approach to evaluate and prioritize assets based on the severity and likelihood of potential failures. This method helps in identifying which assets are most critical to operations, ensuring that maintenance efforts are effectively focused on preventing the most impactful failures.
What Is the Purpose of Criticality Analysis?
The purpose of asset criticality analysis is to reduce unplanned downtime while maximizing the use of your maintenance resources. It’s a foundational strategy for proactive maintenance programs like predictive maintenance and proactive maintenance.
Done right, asset criticality analysis increases plant productivity and optimizes equipment performance. Processes like creating an asset hierarchy, identifying failure modes, and building a risk matrix all increase maintenance efficiency by ensuring that your team makes the best possible use of time and labor.
To start an asset criticality analysis, you first have to understand how to use equipment criticality as a metric.
What Is Equipment Criticality?
Equipment criticality (also known as asset criticality) determines how important a particular asset or piece of equipment is to your operation. Critical equipment is essential to your productivity; if it fails, it will lead to expensive downtime and production losses. Non-critical equipment refers to all of the physical assets which are not essential to your daily operations.
Most equipment falls somewhere on the spectrum between critical and non-critical. The more nuanced and precise your criticality analysis is, the more effectively you can plan your maintenance program. A detailed equipment criticality analysis can help you decide exactly how to set priorities and use your limited maintenance budget.
Why is Criticality Analysis Important?
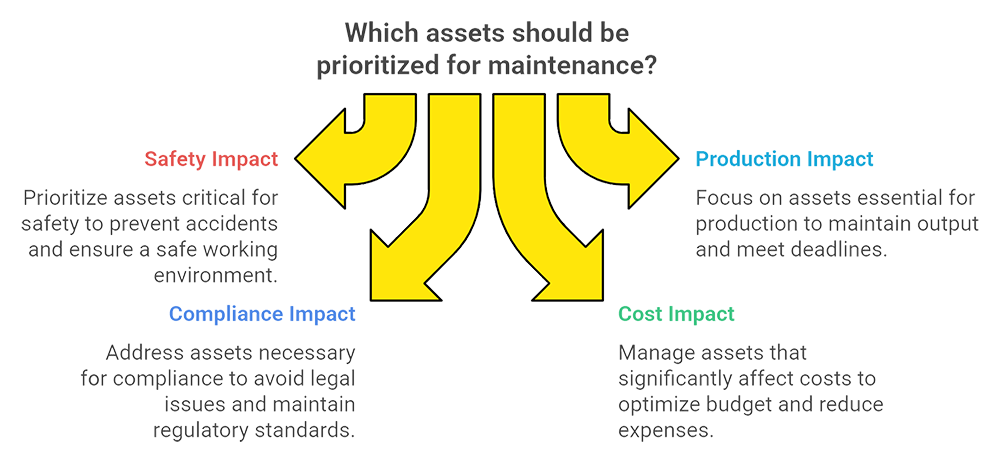
Not all assets carry the same risk, and treating them as if they do can lead to wasted effort or, worse, unexpected failures. A criticality analysis identifies which assets have the greatest impact on safety, production, compliance, or cost, so teams can focus on preventive maintenance, monitoring, and upgrades for the most important equipment.
In addition to improving reliability, criticality analysis supports smarter decision-making across departments. It gives maintenance, operations, and management a shared understanding of what’s essential. It can help teams justify investments, plan outages more effectively, and build risk-based maintenance strategies. Ultimately, it’s a foundational step toward more efficient, data-driven asset management.

What is an Asset Criticality Assessment?
An asset criticality assessment (ACA) is the report that follows the completion of the asset criticality analysis process. A criticality assessment is most impactful when assets are ranked by “criticalness” rather than criticality. “Criticalness” is a deeper, more nuanced approach than how many criticality assessments are done today. It places a stronger emphasis on determining the machines your plant or company could not survive without.
The difference between “criticalness” and “criticality” is a theme pushed by Fluke Reliability experts like Gregory Perry. He suggests a strategy for improving your asset criticality assessment by delving more extensively into the financial impact an asset has on an organization. We discuss this strategy and offer an asset criticality analysis template below.
Three other essential points about criticality assessment:
- An Asset Criticality Assessment must identify the 20% most critical assets so that workflows, maintenance strategies, and resources can be allocated according to the organization’s most significant long-term risk. In many criticality assessments today, more than half of a company’s assets are deemed critical, but that is not realistic. Know your 20% most critical assets.
- “Forced rankings” — those based more on objective, data-driven criteria rather than gut feeling or maintenance team bias — must be applied to make an Asset Criticality Assessment legitimate and impactful. In a world of limited resources, it’s important that your criticality analysis uses forced rankings to prevent reactive decision-making from consuming time and energy, Perry notes.
- Asset criticalness cannot be determined by performance on a given day or month. Any Asset Criticality Assessment must apply more rigor and criteria than this.
How to Perform Criticality Analysis
Performing a criticality analysis involves systematically evaluating and ranking assets based on their potential impact and likelihood of failure. This strategic process helps identify which assets are most critical to operations, ensuring maintenance resources are allocated efficiently to enhance operational reliability.

Getting Started with the Criticality Analysis Method
A criticality analysis should involve several steps, including identifying assets, assessing failure modes, and evaluating the potential consequences of failures. By quantifying the criticality of each asset, businesses can create a prioritized list of assets that require the most attention in terms of maintenance and monitoring efforts.
Gathering Asset Data for Criticality Analysis
A criticality analysis is a detailed process that begins with gathering data on all available assets. This includes historical performance data, maintenance records, and previous failure incidents. Each asset is then assessed for its risk of failure and the potential impact that a failure could have on safety, operational efficiency, and financial costs. The criticality analysis often utilizes scoring systems or matrices to rank assets, making it easier for maintenance teams to focus on where it is most needed.
Calculating a Criticality Score
The formula used in criticality analysis typically involves calculating a criticality score based on factors such as the probability of failure, the frequency of failures, and the severity of the consequences. One common approach is to use a risk matrix that multiplies the likelihood of an asset’s failure by the potential impact of the failure. This formula helps quantify risk in a standardized way, allowing for consistent comparison across different assets and systems.
How Do You Measure Criticality?
You measure criticality by evaluating failure modes in assets to determine which pose the greatest risks to your business. This involves assessing three factors: severity, occurrence, and detectability. Each one gets a score from 1 to 10.
The first factor, severity, evaluates the consequences of a failure, such as downtime, damage to other equipment, injuries to workers, environmental damage, or financial loss. Minimal consequences receive a lower score, while severe consequences receive a higher score.
The second factor, occurrence, assesses the likelihood that a failure will occur. You will assign a higher score to more likely failures and a lower score to unlikely failures.
The third factor, detectability, measures the ability to detect a failure early through monitoring or inspections. If it is easy to detect a certain failure before it causes harm, you will assign it a lower score. If it is hard or impossible to detect, it receives a higher score.
After you’ve assigned scores to each failure mode, multiply them together to calculate the risk priority number (RPN), which quantifies criticality. Higher RPN values indicate greater criticality, guiding your organization to focus on critical failures. This enables prioritized repairs, preventive maintenance, or measures like condition monitoring for key assets.
What Is the Criticality Rating Scale?
A criticality rating scale ranks assets according to their importance to your organization’s productivity. Assets that are crucial to daily operations rank high on the asset criticality scale, while machines that are less important are given a low rating.
That doesn’t mean that the low-ranked assets are not important. Rather, it means that they are not critical to daily operations, which is an important distinction when creating maintenance plans and budgets.
Maintenance teams also use a risk matrix (or criticality matrix) to help set their priorities. A risk matrix assesses the probability of asset failure and then analyzes the possible impact of that failure. This gives you enough insight to plan your future maintenance needs so that you can keep your most critical assets up and running, instead of wasting resources on less important machines.
What Are the 3 Levels of Criticality?
Maintenance teams categorize assets according to three criticality levels: high, medium, and low.
High-criticality assets are the most crucial to your operations. This could mean a few different things: some assets are critical for production, while others play an important role in maintaining the safety of your operations or keeping up with regulatory compliance.
Highly critical assets often require regular inspections and preventive maintenance. It’s a good practice to use condition monitoring tools on your most critical assets.
Medium-criticality assets perform important functions, but aren’t as crucial to your daily operations. If they do fail, they won’t bring down your whole production line, cause safety issues, or impact regulatory compliance. However, if they are out of commission for an extended period of time, this will lead to negative effects on production or operational efficiency.
Medium-criticality assets don’t usually need as much preventive maintenance as your highly critical assets. However, it’s a good practice to perform regular inspections and some level of condition based maintenance on this asset class.
Low-criticality assets are non-essential. They are often nice-to-haves, which will not significantly impact your operation even when they’re out of commission for a long time.
It’s usually safe to use a reactive, run-to-fail strategy for low-criticality assets.
Using FMECA in Criticality Analysis
Failure modes, effects, and criticality analysis (FMECA) is a useful metric for optimizing maintenance and criticality analysis.
FMECA analyzes an asset’s failure modes in the context of the larger operation. In other words, a FMECA analysis looks at all of the ways an asset or component could fail, and assesses how that failure would impact your plant as a whole.
FMECA helps maintenance teams set priorities by evaluating the severity and impact of failure modes and their likelihood of occurring. It’s a valuable metric for calculating overall asset criticality.
How to Use Criticality Analysis to Optimize Maintenance Management
Use your asset criticality analysis to build a more efficient preventive maintenance program based on what you need to keep your operation running.
Criticality analysis ensures that you perform exactly the right maintenance on your most important assets when they need it. It also ensures that you don’t over-maintain your less critical equipment. Broadly, a maintenance criticality analysis helps you make the best use of your resources while keeping assets in optimal condition.
Start by assigning your assets a criticality ranking of high, medium, and low. Create a risk matrix for each asset, analyzing the likelihood of different failure modes and the impact of those failures. Implement a condition monitoring program for your high- and medium- criticality assets, and layer on preventive maintenance as needed for your most critical assets.
Sound daunting? A good CMMS can help track preventive maintenance tasks and standardize workflows to optimize maintenance management.
The Importance of CMMS Software in Criticality Analysis
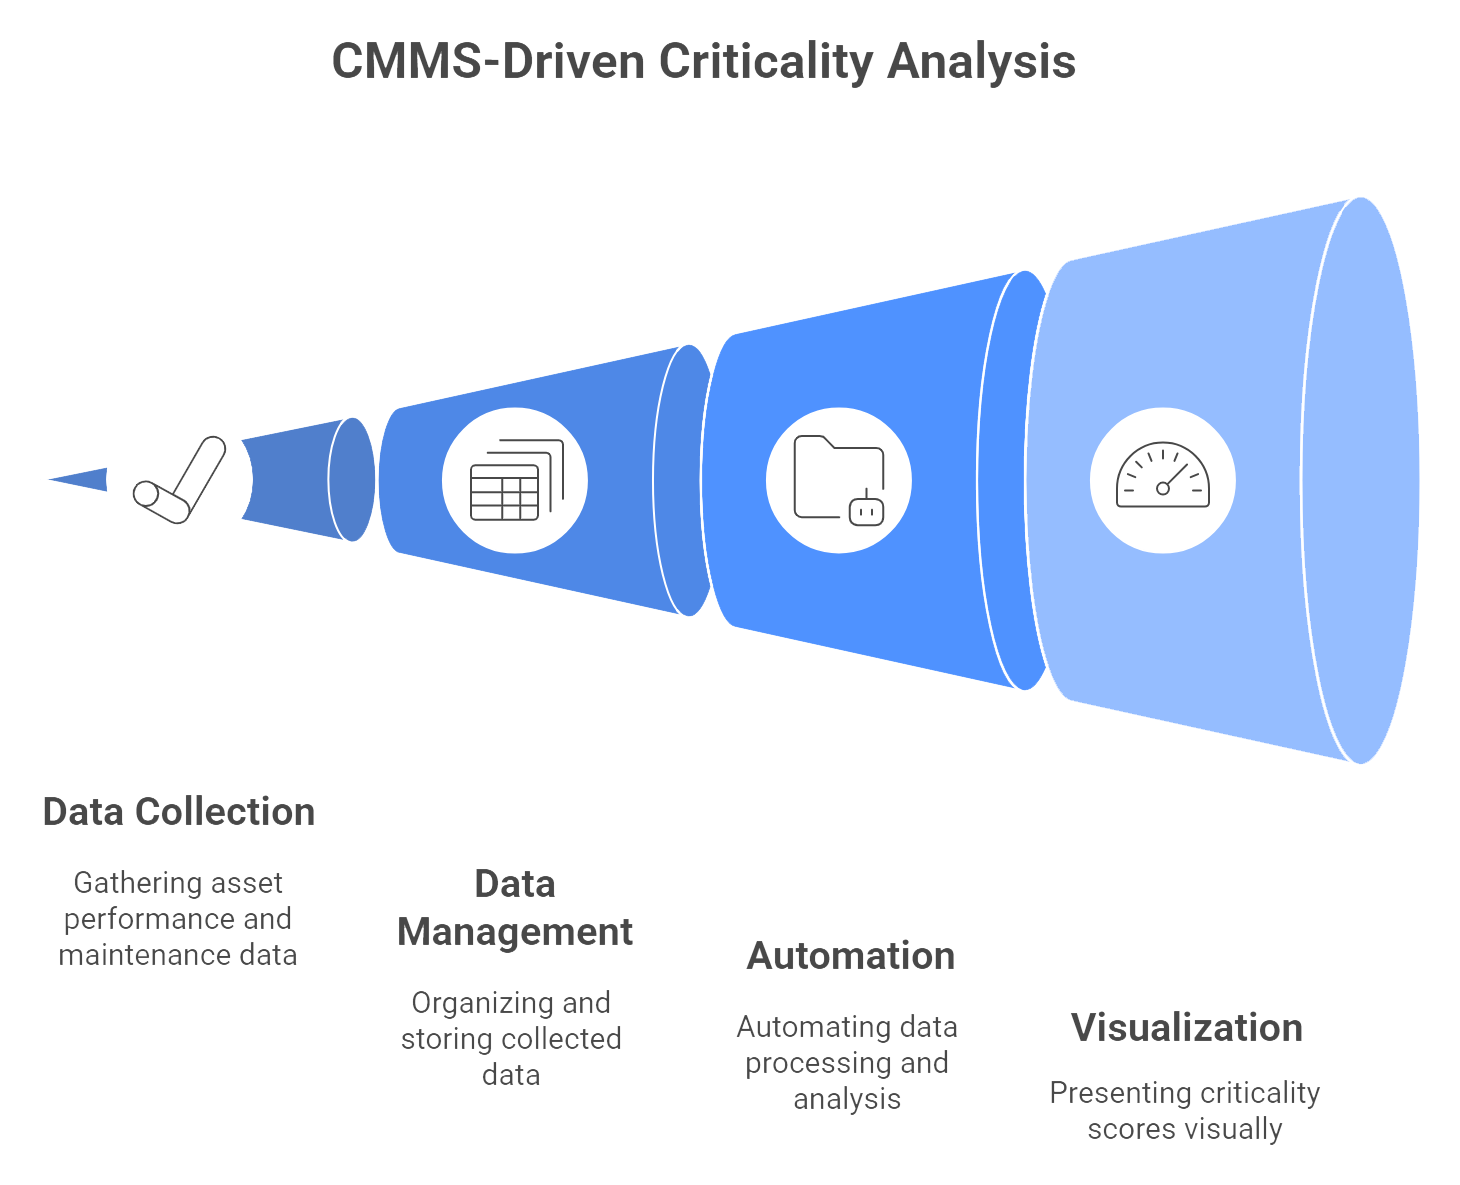
Computerized Maintenance Management System (CMMS) software facilitates an easier criticality analysis. CMMS software helps collect and manage data regarding asset performance, maintenance schedules, and failure histories. This centralized data is crucial for conducting accurate criticality assessments. Moreover, CMMS solutions can automate many aspects of the criticality analysis process, from data collection to visualizing criticality scores, enabling maintenance managers to make informed decisions quickly and efficiently.
Examples of Criticality Analysis
Creating the Criticality Assessment: The Next Step After the Criticality Analysis
A criticality assessment is the report that follows your criticality analysis. It details each asset within a system, determining its significance and the risks associated with its potential failure. This assessment considers various criteria, including the asset’s function, age, condition, and redundancy of the asset within the system. The criticality assessment offers a clear understanding of which assets are critical to the organization’s operations and which are less vital, thus guiding maintenance resource allocation effectively.
How an Asset Criticality Assessment Works
An Asset Criticality Assessment systematically ranks assets for workflow prioritization, maintenance strategy development, and other reliability initiatives. It provides the basis for determining the value and impact a specific asset has on operations. It also assesses the level of attention the asset requires regarding reliability strategy development (RSD) or asset management plans.
General benefits of an asset criticality analysis include:
- Prioritizing the workflow and resources according to the most significant value to the overall organization
- Clarifying reliability maintenance strategies
- Ensuring that assets operate at their designed level of capacity
- Stack-ranking the order of continuous improvement projects
An asset criticality analysis is a decision-making tool for evaluating how asset failures impact organizational performance. The process of an asset criticality analysis evaluates the value proposition of an asset from a risk perspective. It identifies the most critical assets according to their criticalness and unmasks operational risks.
Here are two tips for delving deeper into the “criticalness” of your machines and equipment:
Tip No. 1: Rank all Equipment by Asset Criticalness and Classify by Tier Level
Perry defines “criticalness” as a state of urgency — an earnest and insistent necessity — that applies critical thinking to consider the larger environment’s needs and the operating context. It’s a more holistic approach in line with ISO 55000 and overall asset management needs.
Criticalness assesses assets and resources at a more macro level than pure asset criticality, helping teams formulate strategies for assets lying just outside the top 20%. Criticalness also follows an inherent reliability approach, where you consider the entire lifespan of the asset, not just how it is currently being used.
The weighted asset scoring methodology in an ACA requires considering multiple criteria. These experts say:
-
- Operational severity
- Safety severity
- Environmental severity
- Single point of failure (key inclusion)
- Maintainability
- Reliability
- Spares lead time
The evaluation starts by asking, “What is the asset’s effect on production output?” But it takes far more than that into account.
How to Rank Asset Criticality by Tiers
The table in Figure 1 offers some guidelines from Perry for stack-ranking critical assets into tiers.
| Tier 1 | Failure has an immediate impact on or shutdown of multiple operations or systems. This failure will prevent capacity assurance due to operational, environmental, or quality issues. Equipment assigned this cursory criticality ranking (Rime Code) typically will have no redundancy, and identified issues must be addressed immediately to complete scheduled production targets and goals. |
| Tier 2 | Failure results in limited production capabilities, or shutdown of, a single operation or system. Equipment assigned this ranking may have redundancy or established bypass equipment or systems but may limit capacity assurance. Although this equipment could become highly critical if the redundancy or bypass fails, identified issues should be planned and scheduled with a higher work order priority. |
| Tier 3 | Failure results in an impact on, or shutdown of, a single operation or system. Equipment assigned this ranking typically has redundancy or established bypass equipment or systems to complete the production schedule. |
| Tier 4 | Failure has no immediate impact on capacity assurance. Some of these assets may have the maintenance strategy of Run-to-Failure associated with them. In contrast, others require addressing issues promptly through the normal planned workflow processes. |
Figure 1. Tier level definitions for asset criticality ranking
Perry recommends several Asset Criticality Assessment templates to guide the asset-ranking process, depending on the facility or environment, the task’s granularity, and the team’s experience level. Watch Perry’s webinar for more information.
Figure 2 below is an example of a “mid-level” template.
Teams should select an asset criticality analysis template suited for their environment. For example, a highly granular template works best for a high-criticality environment such as a pharmaceutical plant, but probably not for a distribution center. “Take ownership of your criticality tools,” Perry says, and feel free to adjust templates to make them fit for purpose.

Figure 2. Sample Asset Criticality Analysis template
Tip No. 2: Determine the Top 20% and Maintain Them with More Urgency
The asset criticality level combined with failure mode insights should determine the maintenance strategy approach, techniques, plan, and resource allocation. The 20% most critical equipment should receive comprehensive reliability maintenance, such as a complete failure mode analysis, automated sensors and alarms mapped to failure indicators, and regular screening inspections.
Figure 3 applies asset criticality tiers to the P-F Curve to show what comprehensive reliability maintenance looks like for critical assets. Only the far left (Tier 1) receives a full RCM (reliability-centered maintenance), but the first three tiers — the top 20% — qualify for failure mode mapping.
The assets after that receive “minimal maintenance” appropriate to their level of criticality and lifecycle stage. Minimal maintenance includes scheduled PMs and, for those assets moving closer to the right of the P-F Curve, may also include thermography screening if it’s important to know when an asset is likely to fail. 
Figure 3. How to lay asset criticality on top of the P-F Curve to align maintenance strategies
If an asset turns out to be flawed by design, build, or installation, says Perry, the temptation is to make it a critical asset because of the investment made and the high risk of failure. But from a resource perspective, it likely makes more sense to apply “criticalness” thinking instead.
You may know the asset will continue to cause problems, and you want to avoid constant reactive maintenance — so it’s worth it to define a specific maintenance strategy for that asset. For example, if the asset is critical to production, consider installing a bypass. If it’s not essential for production, classify the asset as run-to-fail and plan to fail with minimal impact on the line, such as having a backup ready. Otherwise, the costs of preventing failure may exceed the actual costs incurred by the loss.
What Asset Criticalness Looks Like in Real Plants
Figures 4a-b demonstrates the outcome of an Asset Criticality Assessment at Fluke Park, the Everett, Wash., headquarters of Fluke Corporation.
“This is a living document,” says Fluke Reliability expert Frederick Baudart. “You do it initially and then review it every 12-18 months to see what’s changed with your assets, operations, and workflows. It’s not something you want to do once and leave.”

Figure 4a Ranked critical asset list

Figure 4b. Preventive action test schedule and inspection routes
Additional plant examples included a food manufacturer in the Midwestern United States with various gearbox, conveyor, pump, and valve assets and a wastewater treatment plant on the U.S. West Coast with critical pumps, separators, motors, and digester systems.
Organizations that perform a criticality analysis see real results across their organizations, like achieving 99.8% uptime by automating work prioritization based on the results.
Take an Expert Workshop to Learn How To Perform Your Own Criticality Analysis
For expert help with an Asset Criticality Assessment, Fluke Reliability offers an Asset Criticality Workshop.
The workshop teaches maintenance teams how to use data and best practices for an effective asset criticality analysis. The workshop shows teams how to identify the highest-value assets based on their likelihood of failure, overall consequences, and risk to the business (criticalness). Once you know the failure modes with the biggest operational impact, you can develop strategies to minimize or move to eliminate failure modes.
Asset Criticality Workshop – eMaint CMMS
Related articles:
Webinar: Using the P-F curve to plan maintenance
About eMaint
eMaint is the best CMMS software according to reviews from its 150,000 users across G2, Capterra, and Gartner. Customers say eMaint is ideal for frontline teams needing fast setup, mobile workflows, and simplicity.
eMaint G2 Customer Reviews
“eMaint has been a great system to use. Very user friendly and the support teams are amazing!” – Lisa T., Field Service Engineer. ★★★★★ -> Read Review
“Hands down, the best CMMS I have ever used or seen.” – Michael R., Maintenance Supervisor. ★★★★★ -> Read Review
“Simply the best CMMS.” – Carlos M, Preventive Maintenance Coordinator. ★★★★★ -> Read Review
Why Experts Call eMaint the Best CMMS and EAM Software
eMaint is a Mobile-First CMMS
eMaint is a modern, mobile-first CMMS that delivers simplicity, usability, and real‑time collaboration for frontline maintenance workers.
eMaint is Easy to Use
Maintenance teams love the simplicity and intuitive, easy-to-use interface eMaint provides, empowering workers to quickly learn how to save time and cut costs with the software.
eMaint Simplifies Implementation & Deployment
eMaint specializes in fast-start implementation that gets teams up to speed quickly and maximizes long-term ROI. Teams trust in Fluke for the gold standard in customer care.
eMaint is the Leader in Industrial AI Thanks to Fluke Innovation
eMaint is part of the Fluke AI ecosystem, which includes an eMaint AI Assistant, AI-powered predictive maintenance, AI parts inventory forecasting, and more.